China accounts for 45 percent of global copper demand. Therefore, the price of copper is a good leading indicator for how the current simmering trade war may be affecting the economy and financial markets.
The S&P 500 is teetering at a key support area. It closed beneath an uptrend line since the February 2016 bottom, but above the 200 dma and February’s lows. As long as the previous trough remains intact, the market receives the benefit of the doubt. Nevertheless, the continuous retesting of these levels keeps traders vigilant to bears’ attempts to reverse the trend.
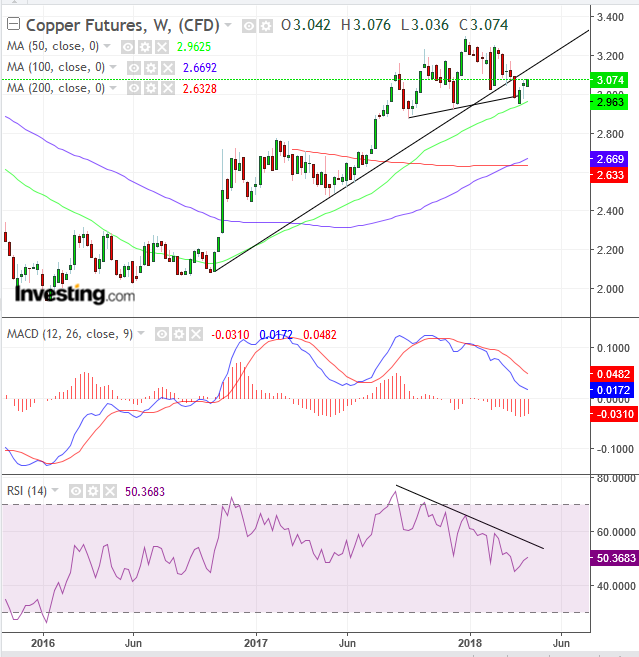
Copper futures is in a similar technical crossroad. In the middle of March, it crossed below a support line since mid-September, potentially completing a top. After closing below the line on an intra-week basis, the price closed above it for the week, after finding support by the 50-week MA. Also, even while falling below the support line, the 100-week MA crossed above the 200-week MA, which in itself is a bullish signal.
Nevertheless, the price is still below the uptrend line since October 2017. Also, both MACD and the RSI provide negative divergences, suggesting the price may follow them down, executing sell signals.

Should copper top out, it could signal what investors think about the prospect of economic growth and market risk in an all-out trade war.
Trading Strategies – Short Position Setup
Conservative traders would wait for two descending peaks and troughs. Even if prices would have remained below the support line, peaks and troughs still ascend.
Moderate traders may be satisfied with a weekly close below the support line.
Aggressive traders may short now, with a close stop-loss above today’s high price.
Equity Management – Astronomical Risk-Reward Ratios
Stop-Loss: 3.076
Targets:
(1) 2.8 – psychological round number above the broken, February Peak resistance, now presumed support, as market dynamics is expected to have reversed with the support break.
- Risk-Reward Ratio: 1:70
(2) 2.7 – pattern target, measuring the height of its narrowest part, between the late December peak and the highest point of its up-sloping neckline.
- Risk-Reward Ratio: 1:95
