Who is Kevin Hassett? Wolfe looks at the Trump ally tipped to become Fed Chair.
Intermarket Analysis Suggests Bitcoin is Going Down, Again
You know that we're bearish on Bitcoin.
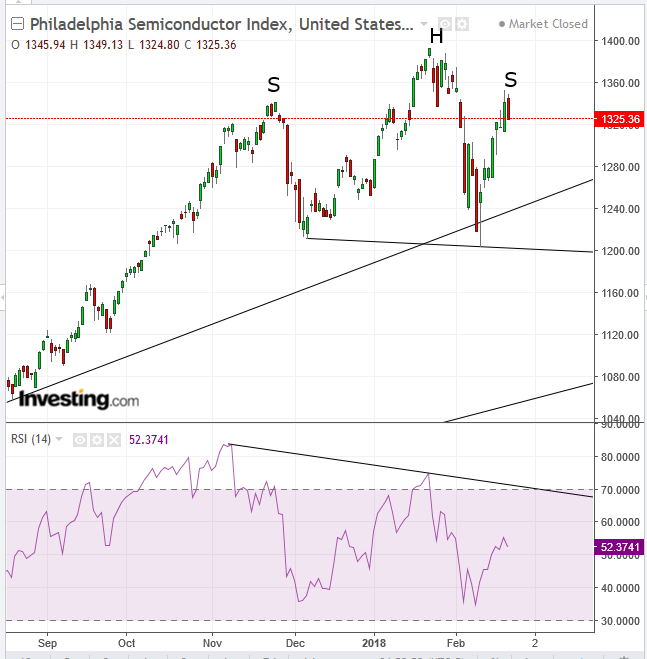
In this analysis, we will provide confirmation of potential bearishness with another, related asset. Yesterday, SOX, the Philadelphia Semiconductor Index closed more than one percent lower, dragged down by NVIDIA Corporation (NASDAQ:NVDA) (-3%) and Advanced Micro Devices Inc (NASDAQ:AMD) (-2.45%), both of which are companies that make graphic cards used for mining cryptocurrencies. These graphic card makers were most likely dragged down by Bitcoin’s 6.75% decline.

Yesterday’s decline occurred at the same level of two peaks ago, when a potential right shoulder of an H&S top was forming. The RSI reveals that momentum has been falling, in negative divergence to the price action. While the January price peak of near 1,400 is higher than the preceding, November peak at the 1,340 level, the RSI peaks have fallen from an oversold 83.7 level to an oversold 75 level. As well, Tuesday’s price reached higher than the November peak, while its corresponding momentum via the RSI is drastically lower, at 52.
The pattern will complete with a downside breakout of the neckline at the 1,200 level, which would also include a fall below the uptrend line since June 27, 2016, when prices fell in the aftermath of the Brexit vote, as well as the 50 dma (green), 100 dma (blue) and possibly the 200 dma (red), which is pointing at the supply-demand focal point, the infamous neckline.
Trading Strategies – Short Entry Set-up
Conservative traders would wait for a downside breakout of the neckline, with a minimum of 3% penetration, to avoid a bear-trap. They may even wait for a crossing below the flatter uptrend line since February 2016.
Moderate traders would wait for a downside breakout, with at least a 2% penetration. Then, depending on their equity management, they may wait for a potential return-move to the neckline, for a closer entry and a smaller exposure. The price for such security is that there might not be a return move. On the other hand, the price for not waiting for a return move is the risk of a false breakout and a larger exposure. That is the risk-reward balance traders must understand and accept, if they want a shot at ongoing success.
Aggressive traders may short now. They might wait for the price to retest yesterday’s or Tuesday’s high price for a better entry as described in the previous paragraph, for moderate traders.
Stop-Losses (Above Levels)
- 1,353.36 – Tuesday’s high price
- 1,393.40 – January 23’s high price
Targets (Above Levels)
- 1,304.55 – 50 dma (green)
- 1,280.59 – 100 dma (blue)
- 1,250 – uptrend line since June 2016 and round number support
- 1,200 – neckline, also a support line
- 1,185 – 200 dma (red
- 1,020 – implied pattern target, measuring its height
There are many trading strategies available for the same instrument in the same time. A trader must establish a plan, which would include his resources and temperament. This is crucial and determines success or failure.
Pair entries and exits should provide a minimum 1:3 risk-reward ratio. They should suit your time frame, with the understanding that the further the prices, the longer it will take to achieve them. Finally, understand that these guidelines are probability-based, which means by definition they include losses on individual trades, with the aim of profits on overall trades.
