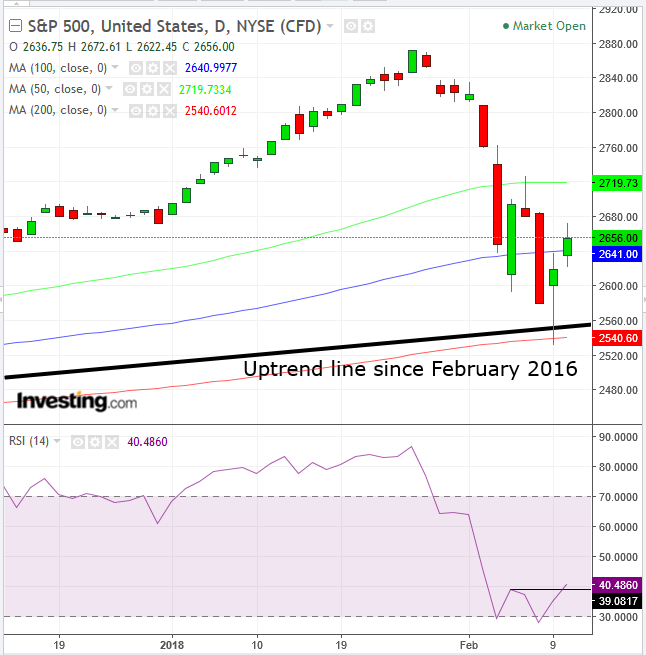
US equity investors recently experienced the worst two weeks within the last two years. While the recent two days were the best in the last 18 months, stock prices may need more time to regain investor trust. Still, Wall Street firms have been telling their clients to buy the S&P 500's dip. Then again, it’s what they’ve been saying all along, including before the crashes.
Even after the near 12 percent correction from the January 26, 2,872.87 peak to Friday’s 2,532.69 intraday low, valuations at 24.80 are still historically high.

Technically, while the highs and lows are with a downward bias, demonstrating that bears are stronger, the easing of the drop suggests momentum is turning around after the Friday intraday low found support of the 200 dma (red) and yesterday climbed back above the 100 dma (blue). The question is whether it would successfully cross above the 50 dma (green), below which it fell 6.6 percent by Friday on an intraday basis, the most since January 2016.
The RSI completed a double-bottom from an oversold level. Its upside breakout of the neckline, which means that the current momentum is higher than that of February 6, formed a positive divergence to the price, which is still lower than the February 6 price. As a leading indicator the RSI suggests that price will climb above its February 6, 2,701.04 high price.
Trading Strategies
Conservative traders would only enter a long position after a new peak would form, confirming the uptrend.
Moderate traders may go long when the price returns above its 50 dma (green), which has proven a support since 2016.
Aggressive traders may risk a long position now, relying on the RSI double-bottom completion and positive divergence, as described above.
Equity Management
Stop-loss:
- Below 2,641, the 100 dma (blue).
- Below 2,622.45, yesterday’s low.
- Below 2,540, the 200 dma (red)
Targets:
- 2,719, the 50 dma (green)
- 2,727, Wednesday’s shooting star
- 2,872, January 26 record both high and close
Pair a stop-loss and target that would provide a minimum 1:3 risk-reward ratio and that suits your time frame, with the understanding that the further the prices the longer it will take to achieve them. Finally, you understand that these guidelines are probability-based, which means by definition they include losses on individual trades.
Disclaimer: All investments have many risks and can lose principal in the short and long term. The information contained herein is not guaranteed, does not purport to be comprehensive and is strictly for information purposes only. Anyone reading this agrees, understands and accepts that they take upon themselves all responsibility for all their investment decisions and to do their own due diligence, and not to hold Pinchas Cohen responsible. Pinchas Cohen does not assume any liability for any direct, indirect or consequential loss that may result from the reliance by any person upon any such information or opinions. Any expressions of opinions are subject to change without notice. This document does not constitute an offer or an invitation to trade or invest. No party should treat any of the contents herein as advice
