The yen bounced off a retreat this morning after the BoJ announced they were trimming purchases of 10-25 year bonds by 10 billion yen ($89 million). However, compared with previous policy this is actually just a relatively minor tweak.
Taper Tantrum?
Still, it didn’t stop traders from selling dollars and buying yen, even after Governor Haruhiko Kuroda said last January, in response to speculation about the significance of similar tapering, that the central bank did not intend their actions to be viewed as signals on policy intentions. On the contrary, as recently as during the past two weeks, he emphasized that Japanese inflation remains far from the two percent target policy makers continue to eye. Consumer prices in Japan rose 0.6 percent YoY in November, while the 2017 average was 0.4 percent. It appears that Japan’s “deflationary mindset” isn’t going away anytime soon. Why, then, the big move? Apparently, its consensus sentiment.
Market moves dominated by sentiment aren't necessarily a losing proposition. On June 27, traders interpreted comments from ECB President Mario Draghi to mean the ECB was about to begin tapering. The euro jumped 1.4 percent that day. And even when ECB Vice President Vitor Contanccio attempted to clarify that Draghi wasn't trying to signal tapering, he couldn’t dissuade euro bulls. The currency extended its advance, even after repeated attempts by the ECB to dampen sentiment. Indeed, since that event the single currency gained more than another 6.5 percent until its September 8, 1.2100 peak, and almost 5.5 percent to date.

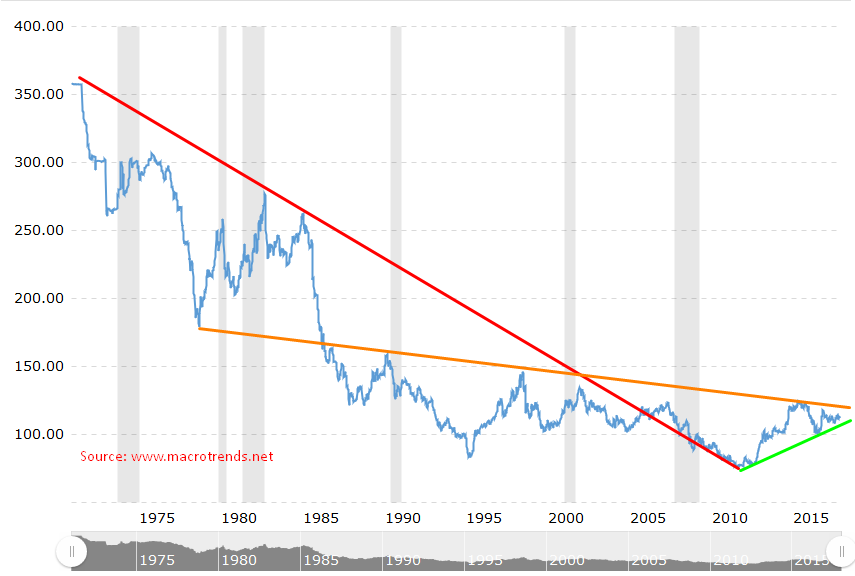
The USDJPY pair has been falling since the 1970 Plaza Accord, an agreement among the largest economies to intervene in the currency markets to depreciate the US dollar in relation to the yen and Germany's former currency the Deutsche mark. It slipped from the 350.00 price level in the early 1970s, until it reached 75.00, between 2011-2012 (red line), from which point it began to climb (green line), when then newly-elected Prime Minister, Shinzo Abe, pledged to force the BoJ into ultra-easy monetary policy.
At that point Japan’s trade situation seemed to be deteriorating, falling from a trade surplus into a deficit alongside an expanding US economy which many believed signaled that the Fed would begin tightening its ultra-easy monetary policy. Note that the rate of descent for the currency has significantly fallen off since 1990 (orange line).
Macro Trend Remains Down
While the macro trend (red line) slowed, it's still in decline (orange line), which is being tested by the long-term trend since 2012 (green line).

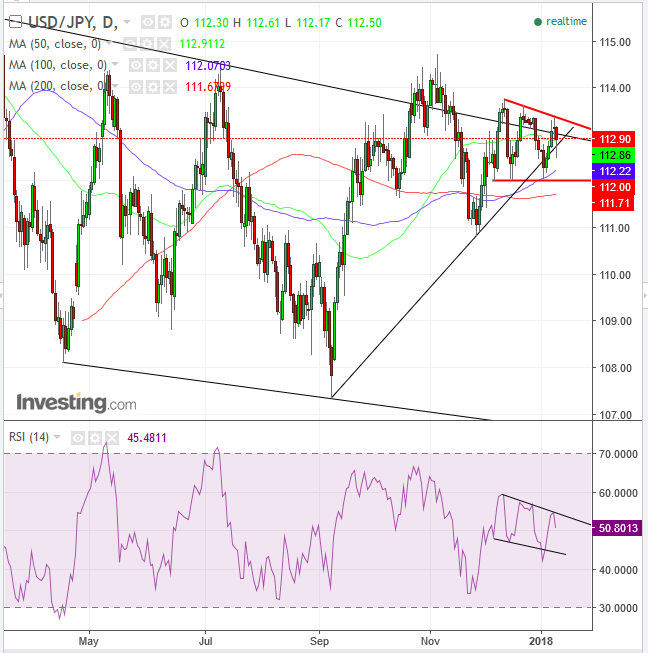
The dollar-yen pair is on the edge of a knife. A small move in either direction may determine the next trajectory. Since the March 10, 115.51 intraday spike, the pair has been trading within a downward biased range, with a 114 top and a 107 low.
On October 31 the pair was provided an upside breakout, reaching a 1-percent penetration by November 6, with an intraday high of 114.74. However, the breakout proved to be a bull trap, falling back into the pattern, which saw the pair fall as low as 110.83 on November 27.
Again, between December 8-12 the pair tried to break out of the pattern but has been trapped within a range, with a downward bias. The yen is falling again in today's trading after yesterday’s high wave candle at the very top of the range. It was the third time the price reached the range top, each time above the range top since March 10.
Fundamentally, the greenback has an overwhelmingly favorable interest rate differential. As discussed above, Kuroda blatantly clarified that this differential will continue to widen, favoring the dollar.
Supply-Demand Pressure Point
An upside breakout of the smaller range since December 12 would include an upside breakout from the larger range since March 10. It would signal a shift in the supply-demand balance, which would make sense considering the unbalanced interest rate differential.
A downside breakout of the smaller range, however, would signal a resumption of the trading range since March 10, with a 107 bottom. This would include the pair crossing below the 50 dma (green), 100 dma (blue) and 200 dma (red), all of which have been below the price since the price crossed over the 200 dma (red) on September 26.
The positioning reveals the supply-demand pressure point, providing a support to the price. Falling below the smaller range and the moving averages would signal a resumption in the supply-demand status quo. Why, with such unfavorable interest rate differentials? Potentially, because of its haven status.
Note, that while the price lows of the range remained flat, their momentum has been falling, as seen in the RSI, providing a negative divergence, a sell signal.
Trading Strategies
Short
Conservative traders would wait for a downside breakout of the smaller range to be followed by a trough lower than the former, November 27, 110.83 low, to confirm the reversal from the short-term uptrend line since September, and the resumption of the long term downward range since March 10.
Moderate traders would be content with a downside breakout of the smaller range.
Aggressive traders may range-trade, shorting now that the price is toward the range-top, with the bottom for a target. They would then have the option to close the position, keep it open for an expected downside breakout, or close it partially to prevent a loss in case of a bounce.
Long
Conservative traders would wait for an upside breakout with a 3-percent penetration to 116.40 to filter out bull traps.
Moderate traders would wait for an upside breakout with a 2-percent penetration to 115.25, which would also cross the 115 key-level.
Aggressive traders are normally satisfied with a 1-percent filter. However, the November 6, 114.74 high provides a resistance, as traders may short on hope of a repeat of the last time the price reached that level, falling 3.75 percent to 110.83 on November 27. Therefore, prudent aggressive traders would enter a long after a return move to the small range and place a stop-loss beneath the range-top.
