by Pinchas Cohen
Yesterday, the S&P 500 hit a new record-high, after the latest US manufacturing data resoundingly beat expectations, with the fastest pace of growth for the release in 13 years. While the US benchmark index reached an all-time high, its gain was only 0.39 percent. At the same time some sub-indexes outperformed.
The biggest gainer among the sub-indexes was materials, via the Materials Select Sector SPDR (NYSE:XLB), which was boosted 1.09 percent. The most obvious fundamental reason for the surge would be recent Chinese growth figures, showing it's on pace for its fastest expansion in five years. Australia's market rallied based on the bullish read from its biggest trading partner and largest buyer of metals.
Not surprisingly, this increases speculation that a growing demand for metals is next. Much like the 0.85 percent boost the financial sector received earlier this year after Fed Chair Janet Yellen reaffirmed the strong possibility of a December rate hike, yesterday's rally was led by materials, which surged.
Bullish Falling Flag

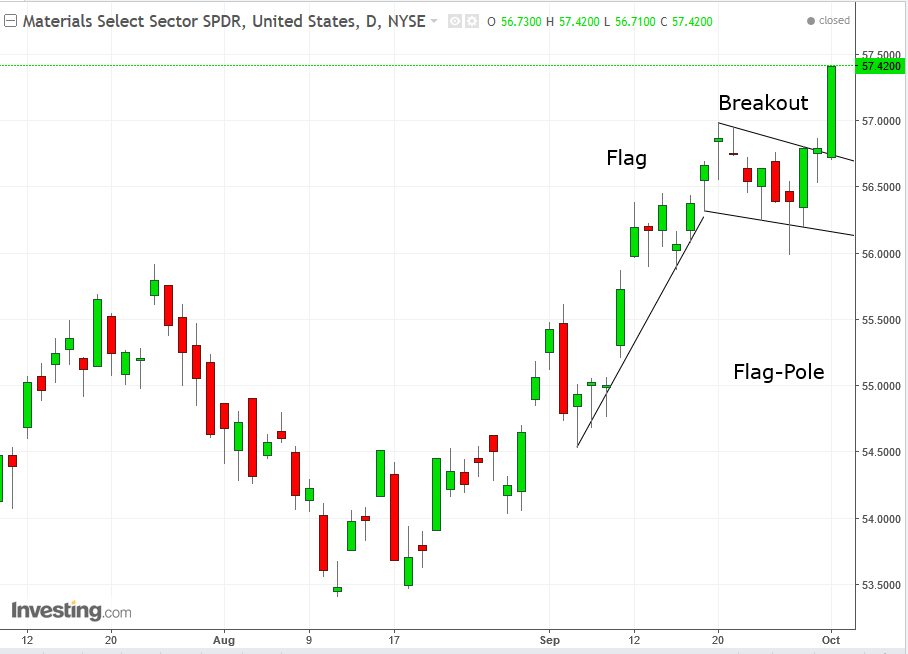
The materials surge provided an upside breakout to a continuation pattern (bullish, in a rising market) named Falling Flag.
The trading pattern is formed by the psychology that takes hold of traders. It begins with the “flag pole,” a sharp move, in which traders race each other to take advantage of a price they suddenly perceive as lower than its value, a disequilibrium they aim to heartily correct, as-soon-as-possible.
In their excitement, they don’t always have the time or presence of mind necessary for in-depth analysis. Then, suddenly—at some point—they fear they've gone too far. At which point they stop.
It's here that the body of the flag develops, as the price goes sideways when traders take a breather as they attempt to figure out which way the wind will blow next.
A decisive break out of the flag is the opening shot around which the racers then rally.
Price Targets
Technical analysts measure the target price by the pole, or the preceding sharp move, as the same momentum is expected to repeat itself: 'If it works once, why not again?' traders tell themselves.
The pole is measured from the 54.53, September 6 low, to the 56.98, September 20 high, +$2.44. This places the red target circle around the $59.42 level, which is right beneath the key $60.00 psychological round-number level.
Trading Strategies
Conservative traders wait after a breakout of at least a 3 percent advance, in order to filter out bull traps, followed by a return-move to successfully test the pattern’s integrity, as in its support or resistance (depending on the direction, but in this case by its support).
Moderate traders might either (1) filter the trade, such as a 2 percent breakout and/or a few sessions during which the price remains above the pattern. So far, the price achieved a 1.2 percent breakout; or (2) wait for a return move with a better risk-reward ratio before entering.
Aggressive traders may jump in for a long immediately, with a stop-loss beneath the bottom of the pattern.
Very Aggressive traders might short, upon apparent trading pressure, to ride an expected return move.
