by Pinchas Cohen
The price of gold is balanced on the edge of a knife, at a 5-month low. Its oversold status attracts dip buyers, generally dollar bears (as the two possess a negative correlation) as well as those investors who still hold a a pessimistic outlook on the economy.
These would be the same investors providing resistance to Treasury yields at the top of a range since May. They might also be the same investors who have been shorting commodities, as the outlook for China’s economic growth into the new year is cooling.

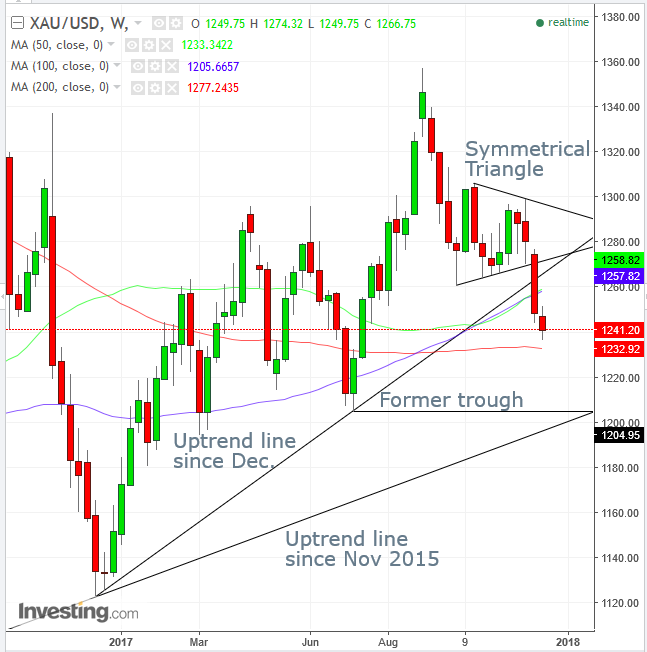
The price of gold provided a simultaneous downside breakout last week to its uptrend line since November 30, 2015, as well as to a trading range since October of this year. During the same timeframe, it crossed below the 50 and 100 day moving averages, which have been intertwined since the early stages of the range development.
The shape of the range is a symmetrical triangle, in which the bottom represents buyers, who propel the price up to the triangle top, which is stopped by sellers, who push it back down. The triangle is symmetrical, because both forces – buyers and sellers – are equally divided. However, since it follows the decline from September, the presumption is that the prevailing trend would be the tie-breaker and send prices further down.
Gold's Downside Breakout Signals Resumption Of Downtrend
The decisive downside breakout, with a 2.5 percent decline—it’s biggest one-day fall since May 1—signaled a resumption of the downtrend prior to its interruption of the triangle. The fact that with the same swing of the sword the price also fell below its uptrend line since December 12, 2016 reinforces the significance of the downside price move at this level.
This point is driven home as it fell below both the 50 and 100 dma, while stopping above the 200 dma (red), which is its final support before retesting this year’s trend (while the uptrend since 2015 would remain intact) with a penetration of the price level where the former trough was registered on July 10, with a low of $1,204.95.
The longer uptrend line since November 30, 2015, from the price of $1,045.85 (the long-term trough of the long-term downtrend since August 2011) currently meets with the July 10 trough, in another example of how everything lines up, as various technical phenomena meet, where the supply-demand pressure points are the strongest.
Trading Strategies – Short Position
Conservative traders would wait on a formal reversal, in which a minimum of two peak-trough series pointing down is registered.
Moderate traders would wait for a likely return-move (occurs roughly in 65 percent of instances) to retest the triangle’s resistance, with the price falling below the advance of the preceding daily rise.
Aggressive traders should wait for a return-move, more likely than usual with the support of the 200 dma (red), as well as after the sharp downside breakdown which is likely to attract dip buyers.
Equity Management
It is advisable to enter trades that provide a minimum 1:3 risk-reward ratio, to increase overall statistical odds.
Stop-Losses:
- $1,257, above the 50 dma
- $1,280, triangle bottom
Targets:
- $1,160, 50 dma, if entry was above
- $1,233, 200 dma
- $1,205, July trough
Example 1
- Entry: 1,241.72, current price
- Stop-Loss: $1,258, risk: $16.18
- Target: $1,233, reward: $25.00
Risk-Reward Ratio: 1:1.5
Conclusion: Potential reward insufficient relative to risk.
Example 2
- Entry: $1,256, 50 dma
- Stop-Loss: $1,280, triangle bottom, risk: $23.50
- Target: $1,233, reward: $22.00
Risk-Reward Ratio: less than 1:1
Conclusion: Potential reward insufficient relative to risk.
Example 3
- Entry: $1,280, triangle bottom
- Stop-Loss: $1,281, risk: $1
- Target: $1,160, 50 dma; reward: $20
Risk-Reward Ratio: 1:20
Conclusion: A dream ratio. Keep this up, and you’ll see your performance improve drastically.
Of course, you can aim for the $1,205, July trough, target, but we wanted to demonstrate that when entering at the right time you don’t have to take big risks and can still have a dream ratio.
