When I decided to start writing a monthly summary of the status of the housing market, I had assumed that housing was going to remain in or settle into a general holding pattern. I assumed little was going to happen to the upside or the downside for a while. Under those conditions, it did not make sense to rush to analyze every housing report the minute it arrived. As luck would have it, I made this switch just ahead of all heck breaking loose in the stock market. Ironically, I even used the term “coiled spring” to describe the stasis in the market.
This has been a tough time for the stock market. As investors connect dots across negative drivers to draw a picture of a looming economic calamity, cyclical sectors have taken their own special pounding. Home builders have quickly gone from a state of serene market out-performance to a rude awakening to what in some cases are multi-year lows. The most hapless stocks are trading back to levels last seen when housing was still rising out of its 2012 trough.
Pictures speak loudly. I have posted below monthly charts of all the home builder stocks I follow the most. I placed a black horizontal line at the most recent intra-day low to provide a reference to the depth of the current selling. The captions include the name of the home builder and the price-to-book ratio pulled from Yahoo Finance. Notice the large divergence in performance and valuation. The market has quickly priced in the most trouble for the smallest and/or most regionally concentrated builders. Suddenly, diversification and size are clear kings of the lots. LGI Homes (O:LGIH) is still a notable exception.
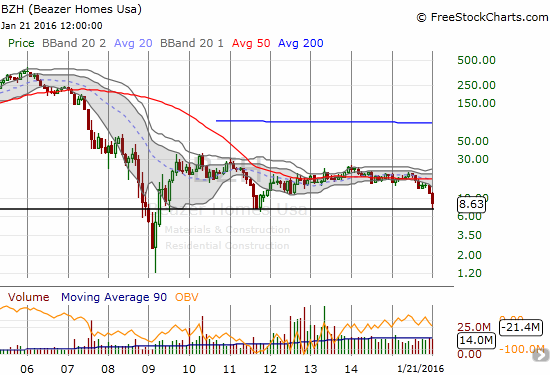
Beazer Homes USA Inc (N:BZH): 0.4
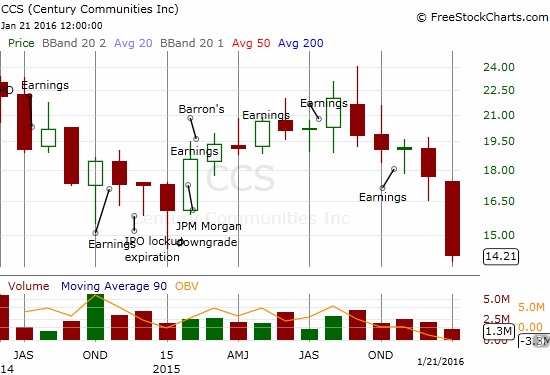
Century Commnts (N:CCS): 0.7
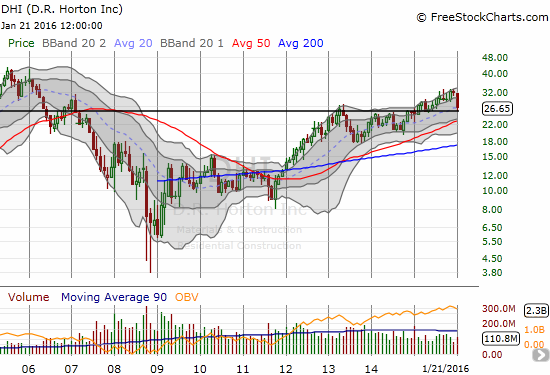
DR Horton Inc. (N:DHI): 1.7
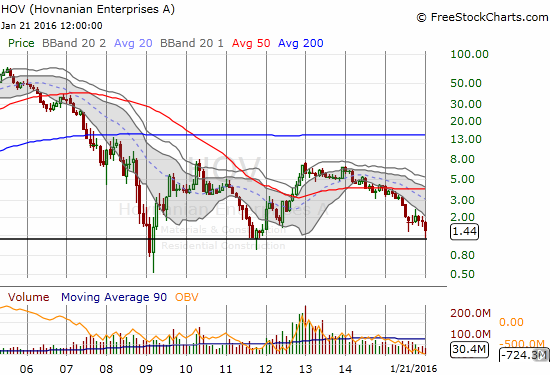
Hovnanian Enterprises Inc (N:HOV): N/A
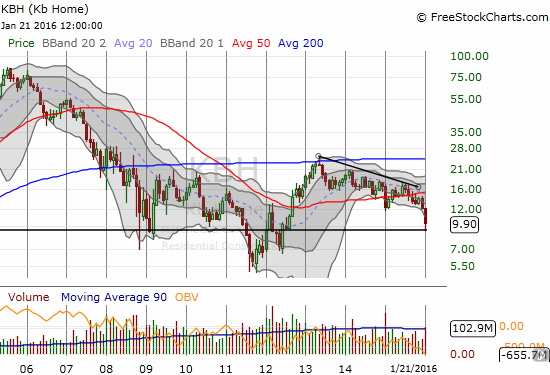
KB Home (N:KBH): 0.5
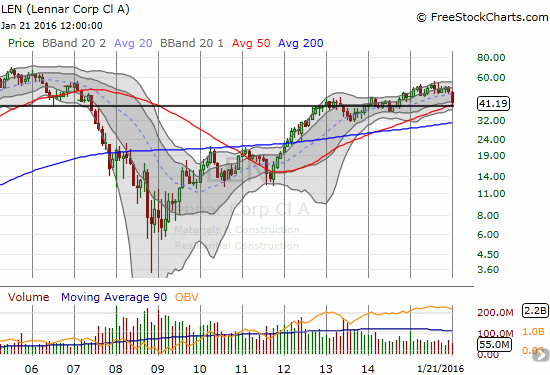
Lennar Corporation (N:LEN): 1.6
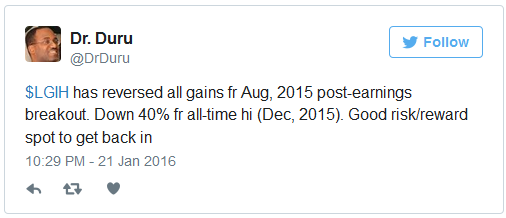
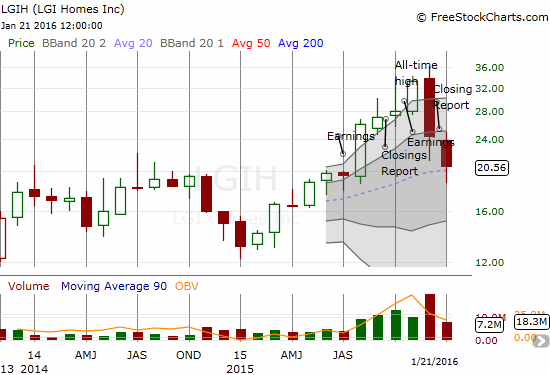
LGI Homes (O:LGIH): 1.8
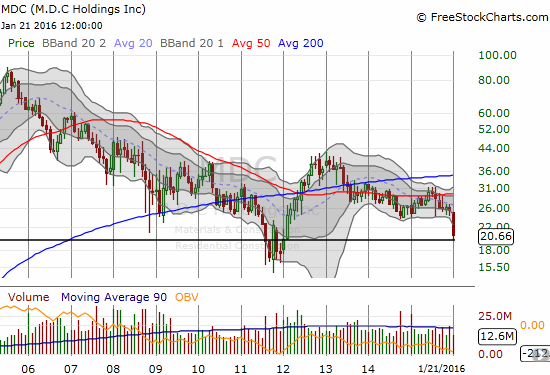
MDC Holdings Inc (N:MDC): 0.8
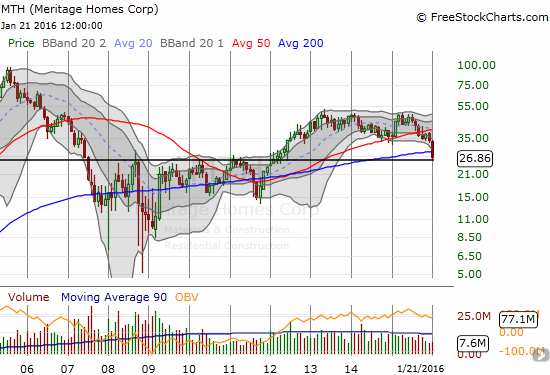
Meritage Corporation (N:MTH): 0.9
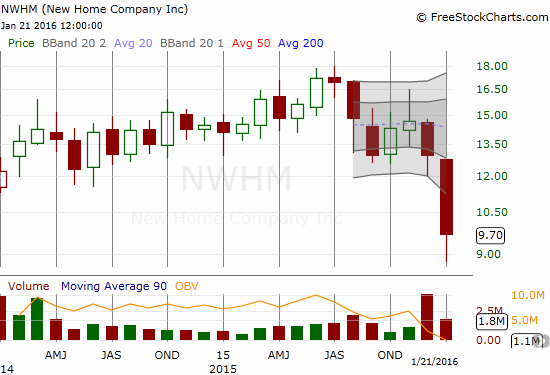
New Home Co (N:NWHM): 1.0
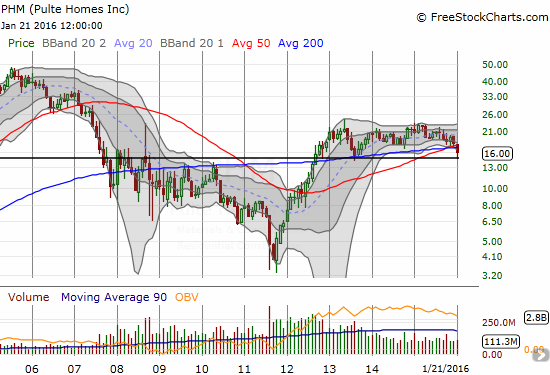
PulteGroup Inc (N:PHM): 1.0
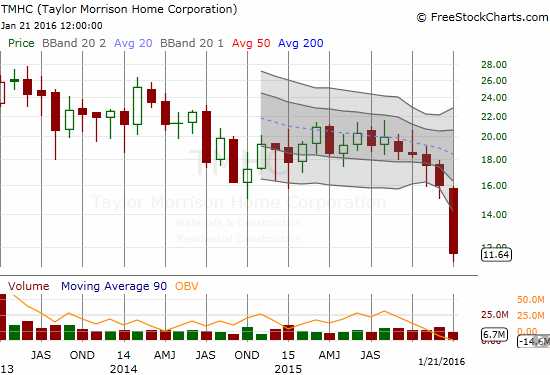
Taylor Morn Home (N:TMHC): 0.8
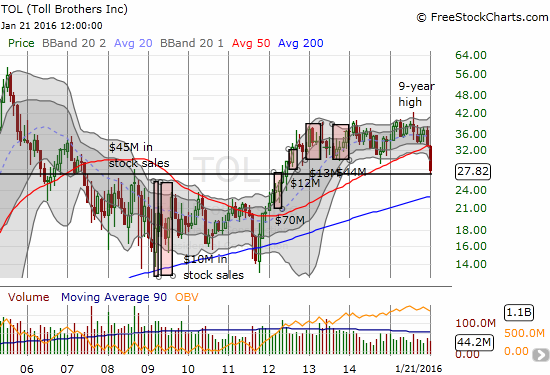
Toll Brothers Inc (N:TOL): 1.2
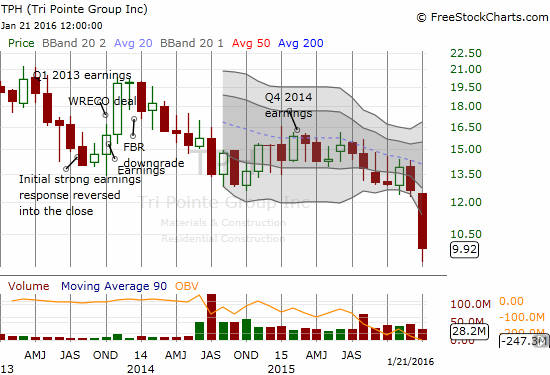
TRI Pointe Homes Inc (N:TPH): 1.0
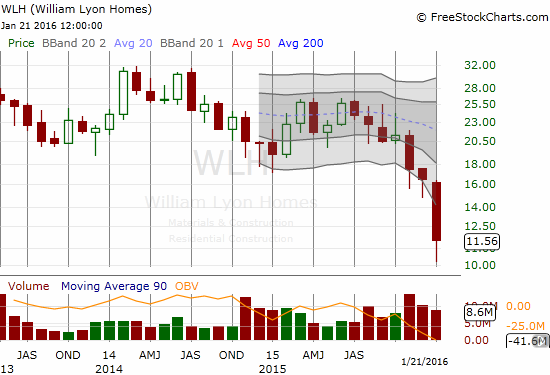
William Lyon Hms (N:WLH): 0.6
I have used this extreme oversold period to pick up new positions in home builders and add to existing positions. I am compelled to take advantage of the discounts when so many builders are trading at or below book value. Of course things could get worse if indeed an economic calamity is around the corner, but I am not expecting one. Things could also get worse if my concerns over the potential of a more extended sell-off in the stock market play out. Under such dire scenarios I will find another buying spot to buy into the eventual recovery.
Finally, the chart below shows how quickly iShares US Home Construction (N:ITB) has descended from its position of out-performance versus the S&P 500 (N:SPY). This convergence has come just as ITB is supposed to experience seasonal out-performance. If at least the traditional relationships hold, ITB should at least out-perform on any relief rallies from here through the Spring selling season.
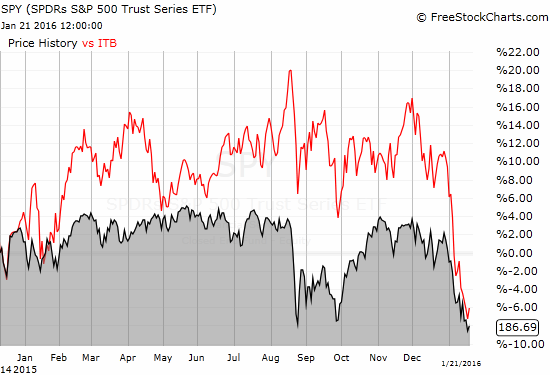
iShares US Home Construction (ITB) spent all of 2015 out-performing the S&P 500 (SPY). Performance has quickly converged in 2016 as ITB has lost 14% year-to-date versus SPY’s 8% loss.
Be careful out there!
Full disclosure: long shares of ITB, CCS, LEN, LGIH, MDC, TOL, and TPH; long call options in ITB, KBH, and TOL
