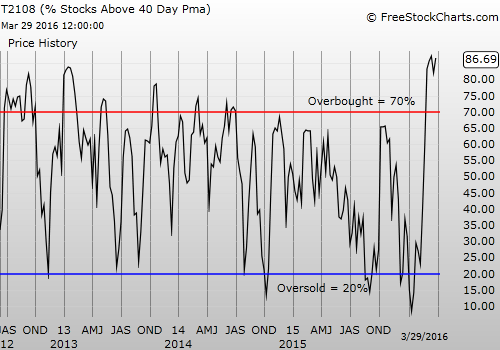
T2108 Status: 78.9%
T2107 Status: 48.7% (10-month high)
VIX Status: 14.9
General (Short-term) Trading Call: neutral
Active T2108 periods: Day #42 over 20%, Day #41 over 30%, Day #38 over 40%, Day #35 over 50%, Day #31 over 60%, Day #30 over 70% (overbought)
Commentary
The S&P 500 (SPDR S&P 500 (NYSE:SPY)) is making a bid to overcome the slippery slope I wrote about in the last T2108 Update. The index closed just a touch above the previous short-term downtrend line.
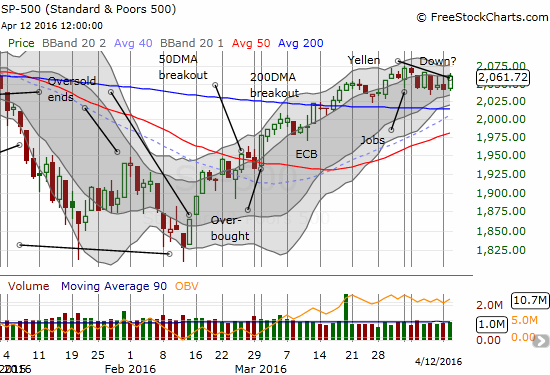
The S&P 500 bounces back. It’s starting to look like an extended period of churn.
T2108, the percentage of stocks trading above their respective 40DMAs, also made an encouraging comeback by bouncing to a close of 78.9%. More importantly, T2107, the percentage of stocks trading above their respective 200DMAs, managed to notch a 10-month high even as the S&P 500 has managed to make minimal progress since late March.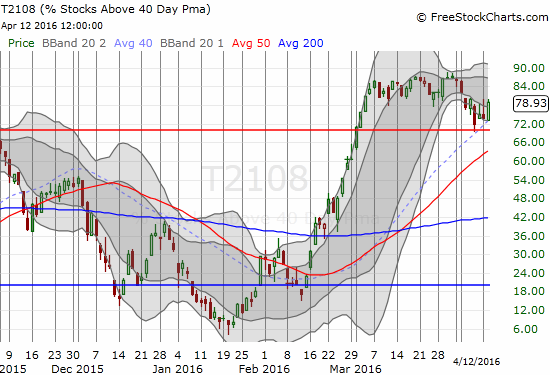
T2108 comes alive again. Can it return to the lofty heights of the 80s?
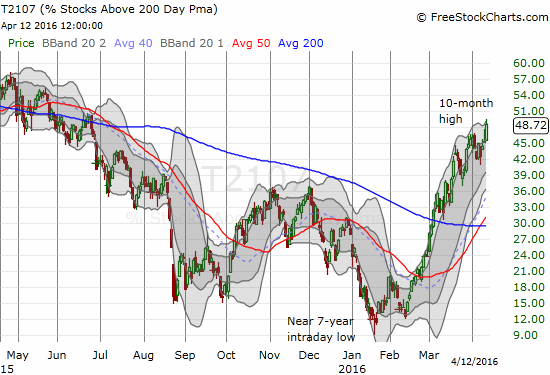
T2107 breaks out to a fresh 10-month high. This indicator now carries the torch representing the market’s underlying strength.
T2107 is now the torchbearer for underlying market strength. While the S&P 500 and T2108 have taken me to the edge of bearishness twice in the past 2 weeks or so, T2107 has never provided the final confirmation. I will change my trading call from neutral and back to (cautiously?) bullish once/if the S&P 500 breaks above the last high set on April 1, 2016.
Encana Corporation (NYSE:ECA) is a Canadian oil and gas company. ECA is the kind of stock that continues to drive T2107 to new heights in this extended overbought rally. The market beat down stocks like ECA for so long and so badly that the 200DMAs were racing to catch-up to the downtrend. I strongly suspect the double-bottom for oil has created a lot of these situations. Today, ECA FINALLY broke out above this critical line of resistance. ECA last traded above its 200DMA around October, 2014…right as the oil patch was falling off a cliff.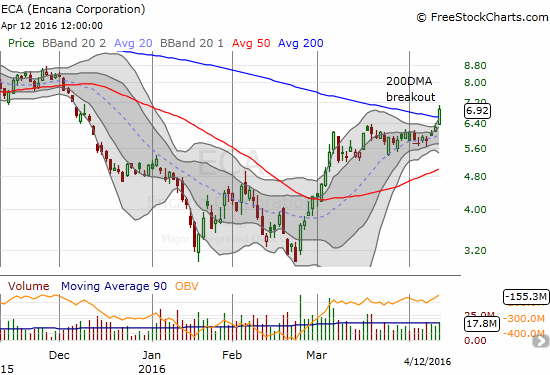
Encana Corporation (ECA) makes a bullish breakout above 200DMA resistance and has now more than doubled in price since its bottom.
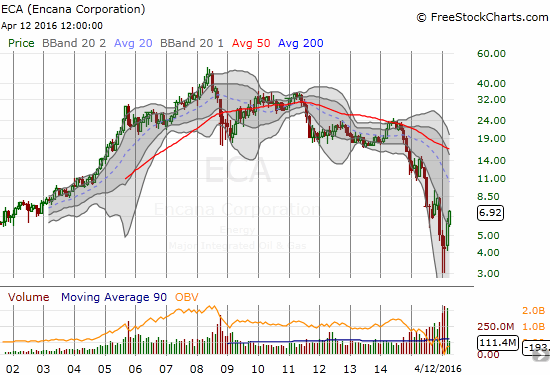
This monthly chart is a stark reminder that ECA’s gains off the bottom are still peanuts compared to where it used to trade not long ago!. The next question is how sustainable is this sharp V-pattern…
Finally, demonstrating the market’s more relaxed mood, the volatility index, the VIX, returned to the 15.35 pivot and closed underneath. Like the S&P 500, the VIX is starting to look like an extended period of churn waiting for a major move up or down.
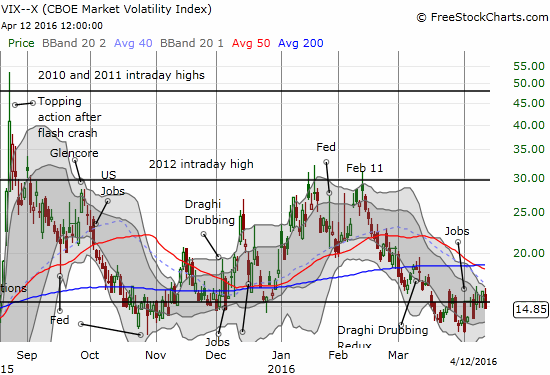
Is the VIX settling in for churn?
With earnings season underway, I am much more interested in playing the stories on individual stocks going into and/or coming out of earnings (but not THROUGH earnings) than in playing the churn on the S&P 500 or the NASDAQ (not shown here). The last T2108 update showed a sample of charts on my radar. On Tuesday, I pulled the trigger again on iShares Nasdaq Biotechnology (NASDAQ:IBB) and will add more on a strong open Wednesday (April 13, 2016). Facebook (NASDAQ:FB) also managed a bounce off its 50DMA – feeble, but still strong enough to warrant a swing play on call options for some follow-through. I still harbor doubts about the sustainability of its support at the 50DMA.
For readers interested in reviewing my trading rules for an oversold T2108, please see my post in the wake of the August Angst, “How To Profit From An EPIC Oversold Period“, and/or review my T2108 Resource Page.
Daily T2108 vs the S&P 500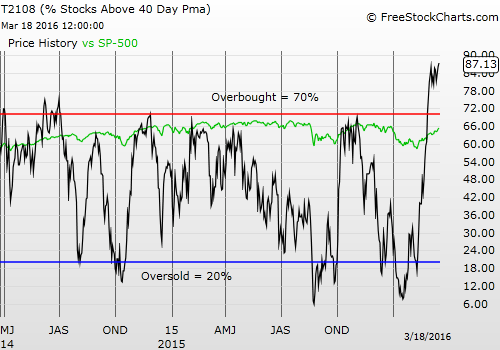
Black line: T2108 (measured on the right); Green line: S&P 500 (for comparative purposes)
Red line: T2108 Overbought (70%); Blue line: T2108 Oversold (20%)
Be careful out there!
Full disclosure: long ECA

