5 Trade ideas excerpted from the detailed analysis and plan for premium subscribers:
Caterpillar (NYSE:CAT), Ticker: $CAT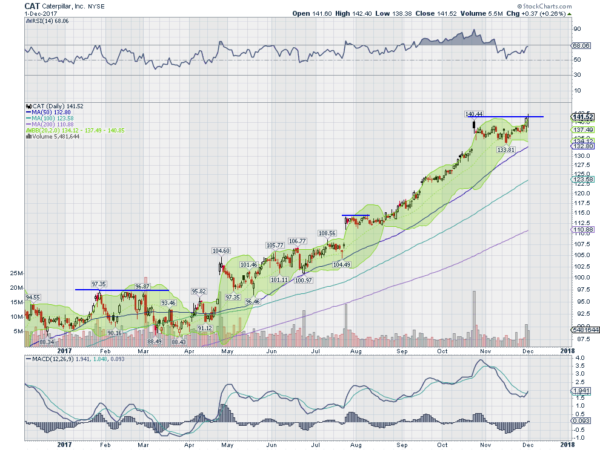
Caterpillar, $CAT, started higher out of consolidation in April. It had a couple of hiccups, but since August has moved steadily higher until late October. A top and shallow pullback was followed by consolidation and tightening Bollinger Bands® last week. At the end of the week they opened and price is now back at the high. The RSI is rising in the bullish zone and the MACD is crossing up. Look for continuation to participate higher…..
Capital One Financial (NYSE:COF), Ticker: $COF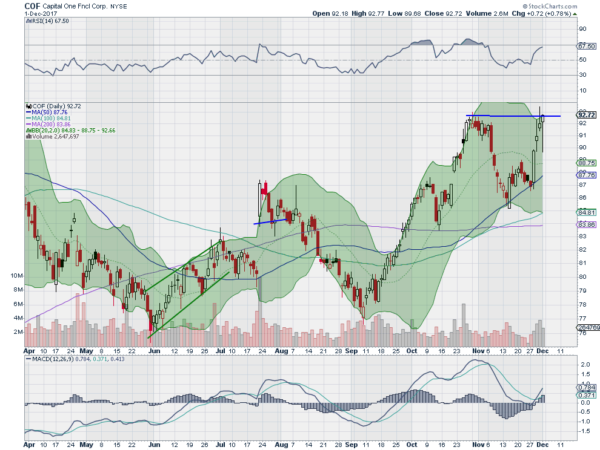
Capital One Financial, $COF, rose off of a low in September and with only s minor pullback along the way rose to a high at the end of October From there it pulled back to the 50 day SMA (also near the 200 day SMA) and then reversed higher. It had a strong week last week and is now at the prior high to start Monday. The Bollinger Bands had squeezed in and are now opening to allow a move. The RSI is rising and bullish and the MACD is crossed up and rising. Look for a push over resistance to participate higher…..
NXP Semiconductors NV (NASDAQ:NXPI), Ticker: $NXPI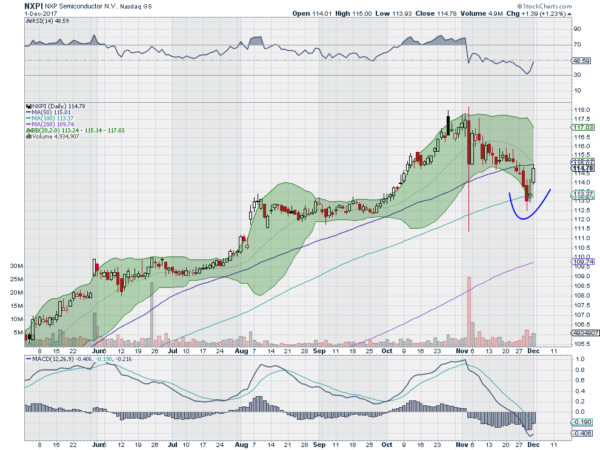
NXP Semiconductors, $NXPI, started higher out of consolidation in January, taking a few steps along the way to a top going into November. The pullback from there touched the 2100 day SMA and then reversed to end last week. The RSI has turned higher again and the MACD has turned as well. Look for continuation to participate higher…..
Royal Bank Of Canada (NYSE:RY), Ticker: $RY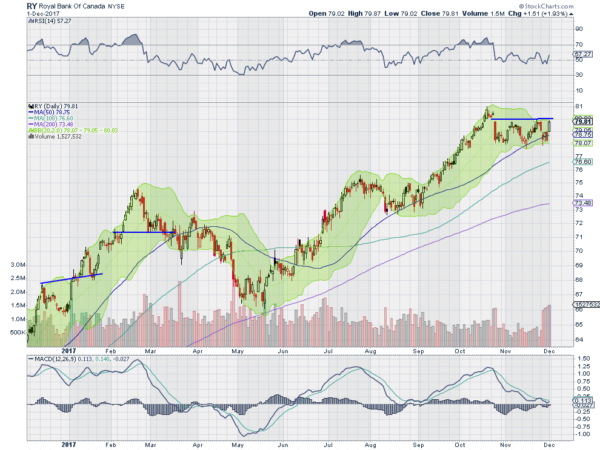
Royal Bank of Canada, $RY, started higher in May after a pullback to the 200 day SMA. It paused in July and pulled back to the 50 day SMA before continuing higher to the top in October. After a brief pullback it has consolidated there ever since. It retouched the 50 day SMA mid-November and then again last week before rising to the top of consolidation. The RSI has held at the mid line each pullback and the MACD is trying to turn higher. Look for a push over consolidation to participate higher…..
Tiffany & Co (NYSE:TIF), Ticker: $TIF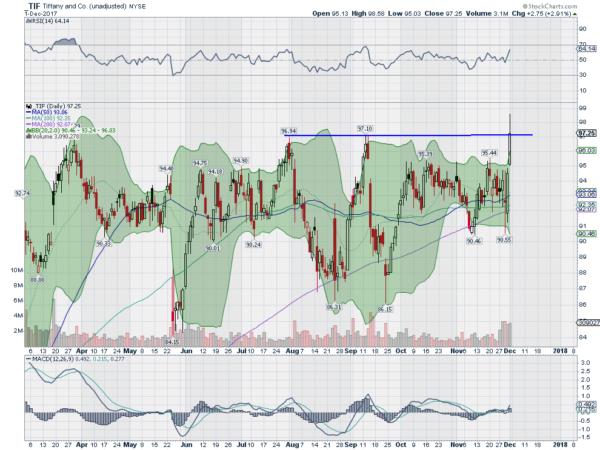
Tiffany, $TIF, has bounced off of resistance around 97 several time is in 2017. Each time it has made a higher low. The last touch there was Friday, and this time it held just over 97, an all-time high close. The RSI is rising and making a higher high while the MACD is crossed up and rising. Look for continuation to participate higher…..
Up Next: Bonus Idea
After reviewing over 1,000 charts, I have found some good setups for the week. This week’s list contains the first five below to get you started early. These were selected and should be viewed in the context of the broad Market Macro picture reviewed Friday which heading into the first week of December sees the equity markets looking strong on the longer timeframe after weathering a short term shock Friday.
Elsewhere look for Gold to consolidate under 1300 while Crude Oil consolidated in its uptrend. The US Dollar Index is marking time with a bias to the downside while US Treasuries consolidate in the range in place since September. The Shanghai Composite is also moving sideways with a bias for a pullback while Emerging Markets retrench in their uptrend.
Volatility looks to remain low but may creep up removing some support for equities. The equity index ETF’s SPY (NYSE:SPY), IWM and QQQ show unfettered uptrends on the weekly charts. On the daily charts they may need a breather after the intraday shock Friday. Use this information as you prepare for the coming week and trad’em well.
