Highest In A Decade
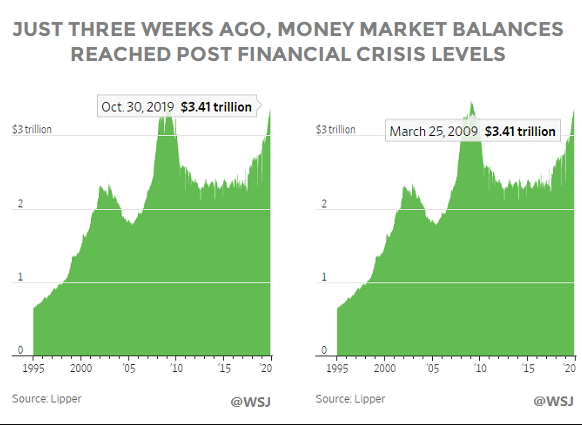
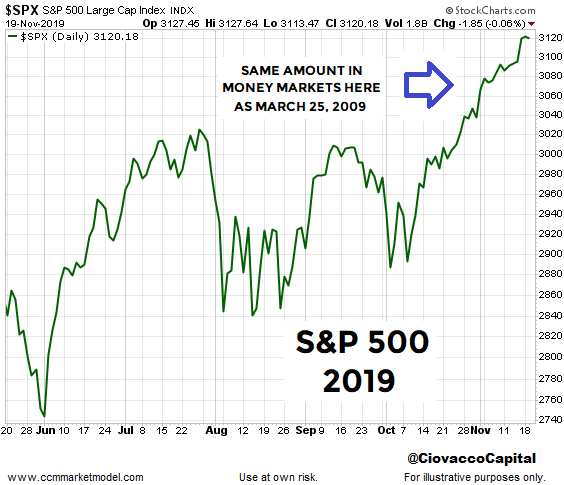
According to Lipper and The Wall Street Journal, money market balances were basically identical on October 30, 2019 and March 25, 2009.

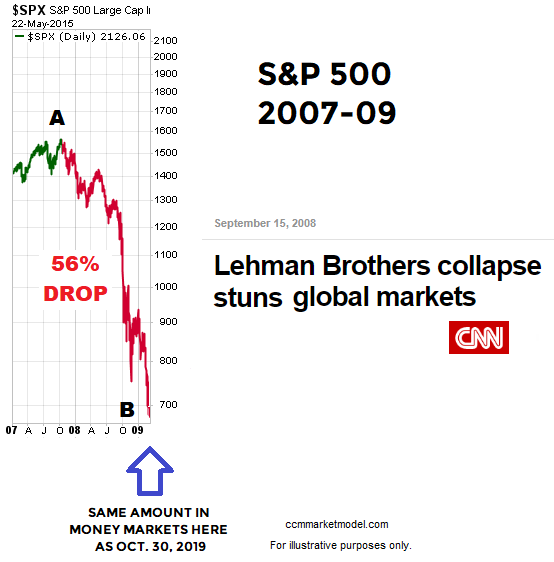
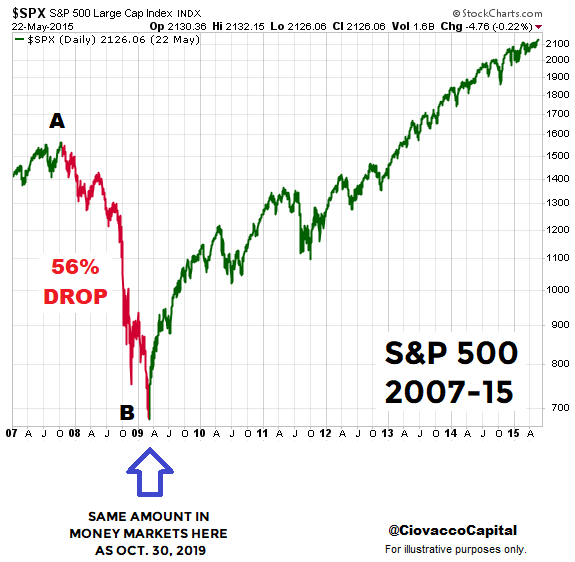
It is easy to understand how money market balances reached extremely high levels in March 2009, given investors had just lived through a painful 56% drop in the S&P 500.

It is also easy to understand how the $3.41 trillion in money market funds on March 25, 2009 helped push the S&P 500 much higher over the next six years.

Given the technical and fundamental facts we have in hand today, it is a bit more difficult to understand how money market balances, just three short weeks ago, were sitting at basically the same level seen in the wake of the 2007-09 crisis that featured the collapse of several key components of the global financial system.

A Small Part Of The Weight Of The Evidence
From The Wall Street Journal:
Assets in money-market funds have grown by $1 trillion over the last three years to their highest level in around a decade, according to Lipper data. A variety of factors are fueling the flows, from higher money-market rates to concerns over the health of the 10-year economic expansion and an aging bull market. Some analysts say the heap of cash shows that investors haven’t grown excessively exuberant .
This post covers a set of facts; nothing more and nothing less. Even if the data above can be explained away, it would have little impact on the weight of the evidence covered in last week’s video. As always, we will continue to take it day by day and see how the facts unfold. We will most likely be covering several new studies in the next CCM weekly stock market video.
