On Monday, I divided the world's equity markets into relative market-value weights for some perspective on asset allocation. The global bond market deserves no less, and so I dive into the numbers below. But first, a caveat. Categorizing the planet's supply of fixed-income components is complicated. Equities, by contrast, are a breeze. In the interest of brevity here, I'm streamlining the task, although no one should confuse the data that follows as the final world on defining the global bond market. For instance, I'm leaving out U.S. munis and collateralized debt the world over. Those are subjective choices, but then again that's par for the course when it comes to setting up rules for investing in bonds. There's relatively little debate when it comes to establishing benchmarks for equities. Bonds, by contrast, are another matter entirely.
The primary motivation is focusing on what's easily replicated with ETF proxies while keeping the rules relatively simple and, hopefully, intuitive. But even here, minds can and will differ. In other words, the following is one man's notion of a rough guide for mapping the global bond market from an asset allocation perspective. With that warning of subjectivity out of the way, let's note that the underlying data reflect prices as of January 31, 2013 in U.S. dollar terms. The source for the investment-grade numbers is Citigroup, with Markit supplying the high-yield data.
- Let's begin with the big picture within the U.S. bond market:

- Next, here's how the U.S. bond market overall compares with foreign debt:

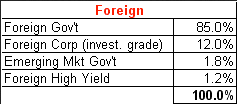
Here's how the foreign component breaks down:

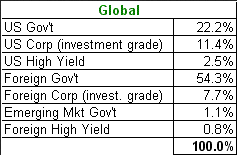
- Finally, looking at all the pieces in context, here's how the global fixed-income pie is sliced up:

