
One of the key issues in structuring an asset allocation strategy is deciding how to divide up the world's equity markets. Everyone has an opinion, but it's usually best to start with the standard benchmark, otherwise known as relative market values based on capitalization. You may choose to second guess Mr. Market's equity allocation, but you should at least have an idea of what you're modifying, if only for perspective. Are you making a big bet in Asia vs. Europe? Is your US allocation hefty vs. foreign developed markets? Are you underweight Japan vs. the rest of Asia? Knowing the answers to these type of questions isn't a silver bullet, but as a general rule it's useful to know how your choices on risk factors compare before you start reshuffling the market portfolio. Indeed, the information on relative market caps may end up informing your decisions on how to customize a portfolio.
The good news is that finding relative market weights is easy. The tough part is deciding what's relevant in terms of defining the planet's various equity betas. There are no standard answers because every investor has a unique objective, risk tolerance, and time horizon. Assets under management also vary, of course, which may influence how finely you slice the list of betas too.
Where to begin? With something simple and intuitive, and proceed from there. What follows is hardly the last word on how to divide up the global equity pie, but it's a reasonable start. The assumption is that we're looking to hold a global equity allocation. For simplicity, I'm ignoring intra-market factors, such as small-cap vs. large-cap or value-vs.-growth. Those are certainly relevant, and I'll review the data on those fronts at a later date. For now, the first cut is thinking about equity beta through a developed-vs.-emerging lens, and then zooming in a bit on the regional definitions.
Keep in mind that there are ETF proxies for each of the market categories listed below, and so it's easy and cost efficient to construct a global equity portfolio with a wide array of risk-factor tilts. With that in mind, the following data presents relative market weights from several global perspectives, based on market caps in US dollar terms, as of February 1, 2013, via S&P Global BMI Indices.
Let's begin with a simple U.S.-vs.-the-rest-of-the-world view: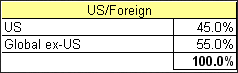
Now let's divide the foreign component into developed and emerging market slices: 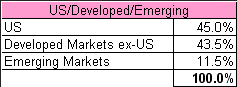
Breaking up the foreign markets into additional pieces introduces another layer of questions. One that frequently comes up: How to treat Canada? This market is left out of some of the older-generation foreign equity indices, but that's an oversight that's easily resolved in newer benchmarks. For perspective, let's break it out. Note too that Israel is usually considered a developed market, but one that doesn't always fit into the usual categories.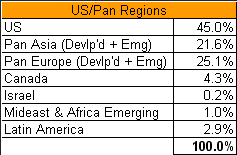
Here's another look at the world's markets, this time in terms of developed regions alone: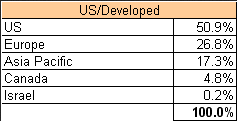
Let's also consider how emerging markets compare on their own terms: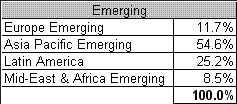
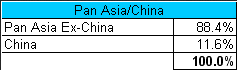
Finally, a couple of loose ends that often pop up in discussions about global market equity allocations, namely: Japan and China. For different reasons, some investors treat these markets as separate entities. Here's how they compare in relative terms vs. the rest of Asia: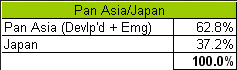
- English (UK)
- English (India)
- English (Canada)
- English (Australia)
- English (South Africa)
- English (Philippines)
- English (Nigeria)
- Deutsch
- Español (España)
- Español (México)
- Français
- Italiano
- Nederlands
- Português (Portugal)
- Polski
- Português (Brasil)
- Русский
- Türkçe
- العربية
- Ελληνικά
- Svenska
- Suomi
- עברית
- 日本語
- 한국어
- 简体中文
- 繁體中文
- Bahasa Indonesia
- Bahasa Melayu
- ไทย
- Tiếng Việt
- हिंदी
Slicing Up The Global Equity Market Pie
Published 02/04/2013, 11:55 AM
Updated 07/09/2023, 06:31 AM
Slicing Up The Global Equity Market Pie
Latest comments
Loading next article…
Install Our App
Risk Disclosure: Trading in financial instruments and/or cryptocurrencies involves high risks including the risk of losing some, or all, of your investment amount, and may not be suitable for all investors. Prices of cryptocurrencies are extremely volatile and may be affected by external factors such as financial, regulatory or political events. Trading on margin increases the financial risks.
Before deciding to trade in financial instrument or cryptocurrencies you should be fully informed of the risks and costs associated with trading the financial markets, carefully consider your investment objectives, level of experience, and risk appetite, and seek professional advice where needed.
Fusion Media would like to remind you that the data contained in this website is not necessarily real-time nor accurate. The data and prices on the website are not necessarily provided by any market or exchange, but may be provided by market makers, and so prices may not be accurate and may differ from the actual price at any given market, meaning prices are indicative and not appropriate for trading purposes. Fusion Media and any provider of the data contained in this website will not accept liability for any loss or damage as a result of your trading, or your reliance on the information contained within this website.
It is prohibited to use, store, reproduce, display, modify, transmit or distribute the data contained in this website without the explicit prior written permission of Fusion Media and/or the data provider. All intellectual property rights are reserved by the providers and/or the exchange providing the data contained in this website.
Fusion Media may be compensated by the advertisers that appear on the website, based on your interaction with the advertisements or advertisers.
© 2007-2025 - Fusion Media Limited. All Rights Reserved.