Cannabis producer Canopy Growth (NASDAQ:CGC) stock lost half its value from its 2021 highs during the March NASDAQ correction.
Shares are attempting to rebound as marijuana legalization and decriminalization tailwinds continue to accelerate as evidenced by New York is edging closer to legalization. Senate Majority Leader Chuck Schumer has pledged to pass federal legalization in 2021.
Cannabis stocks are trading at a premium in anticipation of this event and move higher with each state-by-state approval. Even Mexico is nearing a bill to legalize recreational use of marijuana as it passed the lower house and set for a final vote in the senate.
The recent plunge in shares of cannabis stocks like Tilray (NASDAQ:TLRY) and Village Farms International (NASDAQ:VFF) are presenting cheaper but still expensive entries for risk-tolerant investors seeking exposure. Canopy Growth may be the best-of-breed choice as global alcohol and spirits behemoth Constellation Brands (NYSE:STZ) has partnered and taken a stake in the Company for CBD beverages. Prudent investors seeking exposure in the cannabis products segment can monitor for opportunistic pullback levels to build a position.
Q3 2020 Earnings Release
On Feb. 9, 2021, Canopy reported its fiscal Q3 2020 results for the quarter ending December 2020. The Company reported an earnings-per-share (EPS) loss of (-CC$2.43) as revenues rose 23.4% year-over-year (YoY) to CC$153 million beating analyst estimates for CC$149.94 million. Adjusted EBITDA was (-$68.4 million) versus (-$97 million) YoY. Adjusted gross margins fell 500 bps to 26% YoY.
On Mar. 11, 2021, Canopy Growth presented at the BoA conference. Canopy EVP and CFO, Mike Lee, started off:
“We have already in market some very differentiated cannabis infused products like beverages, which are binging new consumers to the category, partially because it’s familiar format for consumers, but also because it’s a sessionable format like beverage alcohol. And then looking at the case of our Tweed beverages, which are 2.5 milligrams of THC, it’s similar to one serving of beer. So, it’s very approachable in that regard.”
CEO Lee covered its progress in R&D to further its portfolio of products focused on “mood management”, which will be a “gamechanger for the cannabis industry”. The recent launch of Quatreau CBD in November is already the number one selling ready-to-drink CBD beverage in Canada. The strategic partnership with Constellation Brands has strengthened as the Company utilized their manufacturing expertise to design the beverage facility in Canada. Constellations former Chief Marketing Officer is now a Managing Director of the Beer Division. Constellation’s wine and spirits President sits on the Canopy board of directors. Canopy sees 40% to 50% revenue growth over the next several years. CEO Lee summed it up, “It’s still early days in the U.S. for us on CBD, but we’re very happy with the growth we’re seeing from Martha… And we’ve got other products that we’ve not yet announced, but the U.S. CBD market is a viable, high-growth market that we think is going to give u a lot of tailwind over the next couple of years.” The Company is targeting positive Adjusted EBITDA in 2H fiscal 2021 and CapEx is expected to taper off in fiscal 2023 as the economies of scale deliver positive operating cash flow in fiscal 2023 and positive free cash flow in fiscal 2024.

CGC Opportunistic Pullback Levels
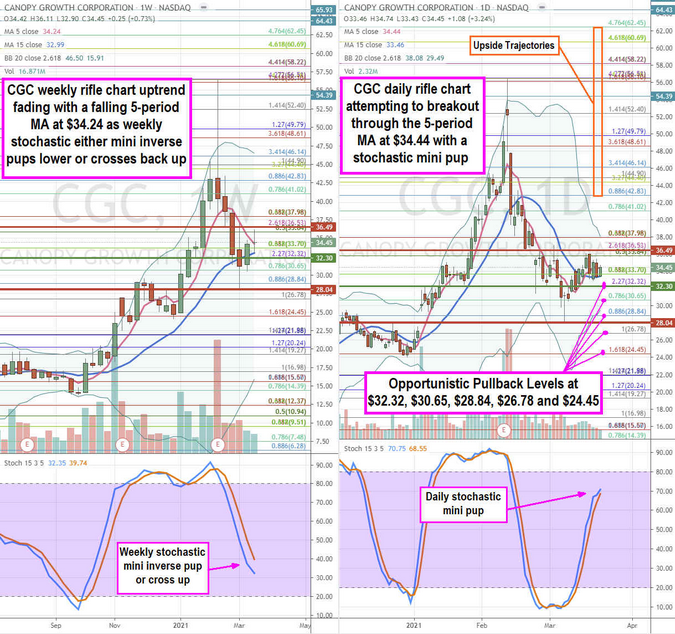
Using the rifle charts on the weekly and daily time frames provides a more precision near-term perspective of the landscape for CGC stock. The weekly rifle chart uptrend peaked on Feb. 10, 2021, at the $56.54 Fibonacci (fib) level. Shares collapsed to a low of $28.04 on Mar. 5, 2021, and proceeded to bounce on the daily market structure low (MSL) buy trigger above $32.30 powered by the daily stochastic mini pup. The weekly rifle chart has a falling 5-period moving average (MA) at $34.24 closing the distance with the 15-period MA at $32.99 powered by the weekly stochastic mini inverse pup. This is turning into a make or break where the weekly 5-period MA crossover through the 15-period MA forms a breakdown or the weekly stochastic crosses up and shares rise back up through the weekly 5-period MA to form a pup breakout. The daily MSL trigger is wedged in between two market structure high (MSH) sell triggers at $36.49 and $28.04. Shares will ping pong between these levels until they breakout or breakdown. The daily stochastic has a mini pup as the daily rifle chart indicates a compression around the $33.70 fib as both the upper and lower daily Bollinger Bands (BBs) compress. Prudent investors can monitor for opportunistic pullback price levels at the $32.32 fib, $30.65 fib, $28.84 fib, $26.78 fib, and the $24.45 fib. Upside trajectories range from the $42.83 fib up to the $62.45 fib. Keep an eye on peers TLRY and VFF.
