The gold price has jumped over 17% from its December low of $1,050.80/oz to a near one-year peak of $1,239.10/oz. In the meantime, the S&P 500 has dropped more than 9%, reaching a new 52-week intraday low of 1,810 on Thursday. Mounting fear is driving investors away from risky assets to safe havens – a pattern similar to the one we saw after last decade’s financial crisis.
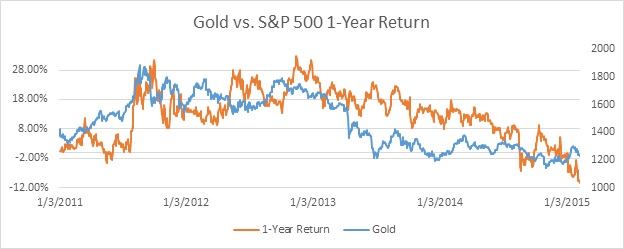
How do we interpret the divergence between gold and equities? Does fleeing to safety hurt stocks? The answer is “not necessarily.” With the right “catalyst” gold can be quite bullish for the stock market. First, let’s take a look at the relationship between gold and the S&P 500. Although the daily prices of gold and stocks are seemingly unrelated, gold is 73% correlated with S&P 500 1-year returns (as shown in Figure 1), 84% with 2-year returns, and 85% with 3-year returns over the past 5 years.

Figure 1. Gold vs. S&P 500 1-Year Returns since 2011
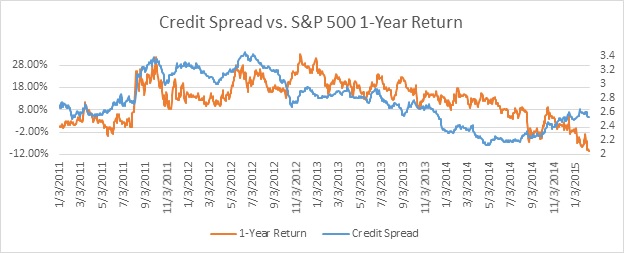
Investors, be aware: the correlation is purely contemporary and does not necessarily translate into predictability. So what’s the “catalyst” we mentioned that is necessary for gold to provide a bullish signal? Credit spreads have been found to affect stock market returns. Elevated corporate spreads indicate a high level of perceived market risk and low liquidity. Figure 2 below shows the co-movement between credit spreads and the stock market. Low credit spreads such as those we saw pre-2007 may signal market optimism; high credit spreads, for instance during a financial crisis, indicate investors’ fear and risk aversion, as well as the potential deterioration of future markets.

Figure 2. Credit Spreads vs. S&P 500 1-Year Returns since 2011
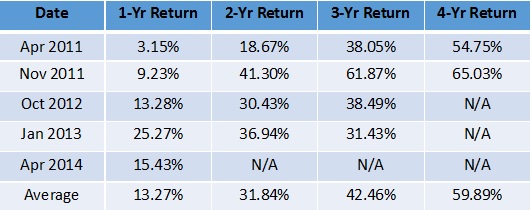
Scaling the gold price by credit spreads provides us a fear gauge per unit of potential risk. A spike in this fear ratio may suggest an entry point due to an oversold market. If we use the 95th percentile to define an oversold market, then we see that there were five such occasions in the past five years. As summarized in the following table, all of the five events were followed by positive returns. The long-run averages range from 13.27% for 1-year to almost 60% for 4-year returns. One key point is that the returns did not monotonically increase from year to year. But given all the market fluctuations that occurred, the yearly returns are still fairly surprising.
Table 1. Yearly Returns After Gold/Credit Spread Ratio Spikes
The last event suggested by this ratio occurred between April and July 2014. The 1-year return was positive, but we are approaching the 2-year return point this summer. Given the current market situation, will the pattern finally break, or will the market rally and keep the ratio’s predictive power alive? While the history detailed above suggests a probability of over 95% that there will be a rebound in the market, only time will tell.
