Those who don’t like my writing style may already call me boring (or worse), but as far as stock holdings go I willingly take on that description. If you’re looking for words about Wednesday's FOMC meeting, you won’t find them here. There are plenty of people picking that thing apart and trying to make chicken salad (news) out of chicken shit (a non-event).
I am not going to go on about the precious metals’ big rip on Wednesday because that is for casino patrons to get excited about. I’ve expected the sector to bounce from oversold conditions. When it takes out real upside parameters (that NFTRH will surely manage) we’ll amp up the hysterics (not really).
The stock market? It’s scenarios are Thing 1 and Thing 2. The 1st Thing is to resume upward now and bring on the climactic suck in sooner rather than later. The 2nd Thing is the healthier one, where the market corrects now and makes new highs and sucks ’em in later. I’ve favored Thing 2, but now it is time to watch short-term events and do what the market says. Okay, before I get off track, on to the boring stuff…
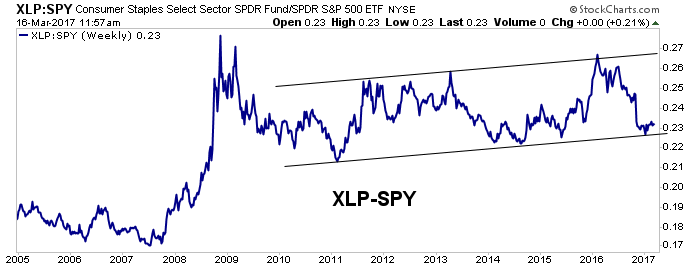
First, look at the Consumer Staples (NYSE:XLP) vs. the S&P 500 (weekly). In relative terms, it looks like XLP is at a buy point.

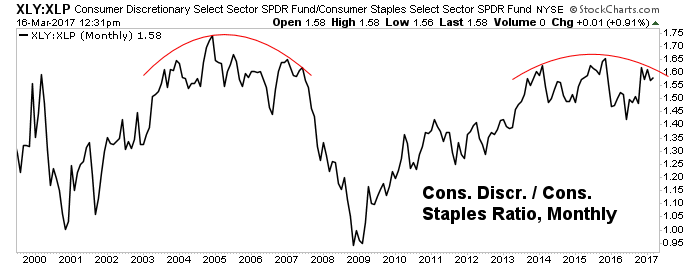
Also, look at XLP vs. its consumer-related bro, NYSE:XLY (monthly). I don’t like the looks of this leading indicator if I am a stock bull hopped up on momo and other substances.

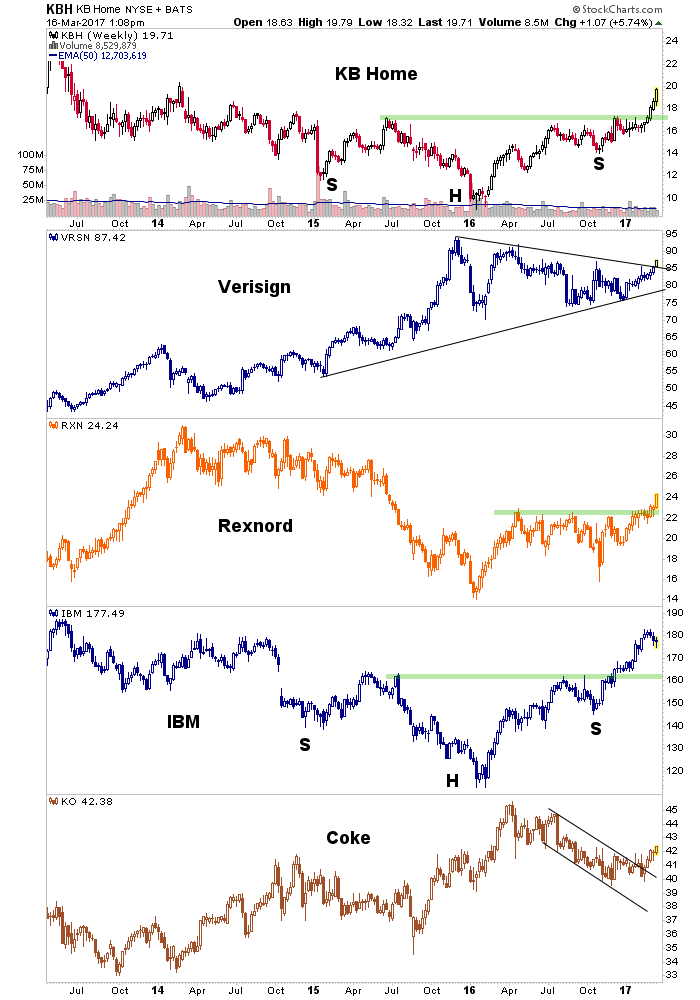
So what do I do? In a high risk market environment I get scared when the average momo is brave and I look to boring companies with constructive charts like VeriSign Inc (NASDAQ:VRSN) (bought a few weeks ago for its chart). I look around for others and find Coca-Cola Company (NYSE:KO) and like its chart (the daily more so than the weekly below). Same goes for Wal-Mart Stores Inc (NYSE:WMT), which had a good quarterly report, is making online inroads and had pulled back a bit.
The Homies presented me with a crazy good chart on KB Home (NYSE:KBH) a couple weeks ago and a subscriber gave me a heads up on the company with the most old fashioned name I’ve ever heard, Rexnord Corporation (NYSE:RXN). Good chart. IBM (NYSE:IBM) was bought back on a pullback to the daily SMA 50. Several of these items have been NFTRH+ technical setup ideas, either here at the site or in the weekly reports.
So anyway, here in a latter stage bull market, rotation and rebalancing seems to make a lot of sense. For instance, 1 year ago we were preparing to get bullish on the Semiconductor sector as Semi Equipment bookings were on the verge of establishing a bullish trend. Here is a public post from May that includes some very bullish developments in Semis.
Remember the multi-stock charts I used to produce back then? They included currently overbought, over loved items like Applied Materials Inc (NASDAQ:AMAT), Lam Research Corp (NASDAQ:LRCX), Cabot Microelectronics Corporation (NASDAQ:CCMP) and the iShares PHLX Semiconductor (NASDAQ:SOXX) ETF. Well, here is a multi-stock chart of a different kind for a different time. Boring stuff, I grant you. But times change and so should peoples’ perspectives and strategies.

