S&P 500 earnings are the “straw that stirs the drink” as Reggie Jackson once said about himself during one of the late 1970’s World Series runs by the New York Yankees slugger.
However, revenue growth is just as important.
Something caught my eye looking at S&P 500 earnings data and I thought it was worth sharing with readers.

David Aurelio of Factset provided these tables yesterday.
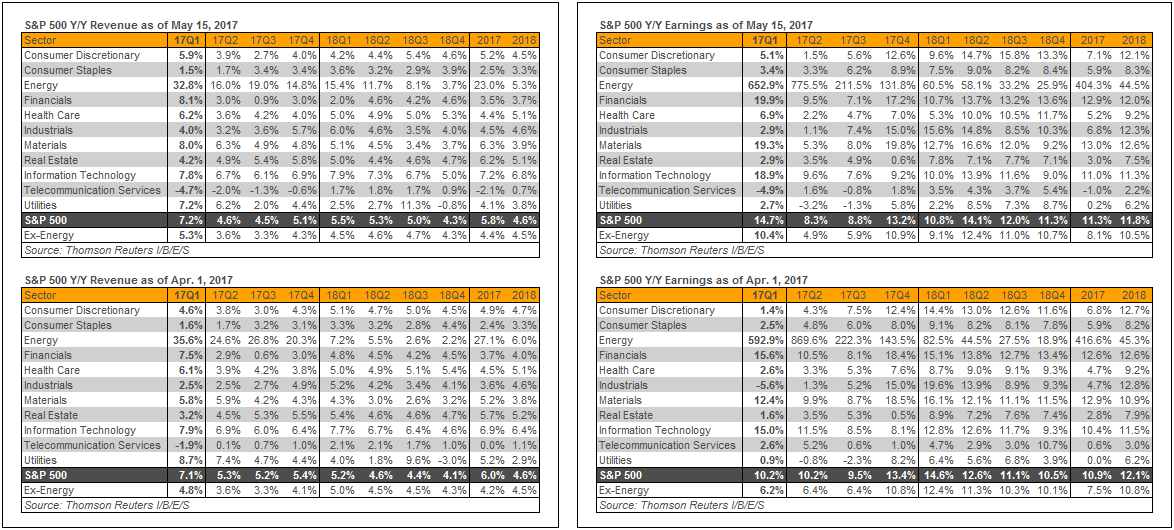
Six weeks into the 2nd quarter, 2017, what I’m looking at are sector(s) that have seen upward revisions to expected revenue growth as of May 15 ’17, versus the April 1 for Q2 ’17 (pre release) data:
Here is the list from the above first table, (i.e. upper left-hand corner):
- Consumer Discretionary: +3.9% as of 5/15/17 vs +3.8% as of 4/1/17 (not a big jump, but still an increase)
- Industrial’s: +3.2% as of 5/15/17 vs +2.5% as of 4/1/17
- Basic Materials: +6.3% as of 5/1/51/17 vs +5.9% as of 4/1/17
- Real Estate: +4.9% as of 5/151/7 vs +4.5% as of 4/1/17
Source: Thomson Reuters I/B/E/S and remember this is for Q2 ’17 revenue estimates.
Maybe more importantly, and a bigger question, “How has full-year 2017 sector revenue estimates changed since April 1 ’17 ?” (Same period i.e. 5/15/17 vs 4/1/17)
- Consumer Discretionary: +5.2% vs +4.9%
- Consumer Staples: +2.5% vs +2.4%
- Industrial’s: +4.5% vs +3.6%
- Basic Mat: +6.3% vs +5.2%
- Real Estate: +6.2% vs +5.7%
- Technology: +7.2% vs +6.9% (what’s critical about Tech’s revenue revisions is that it’s unrelated to cash repatriation.)
- S&P 500 (ex-Energy): +4.4% vs +4.2%
Analysis / conclusion: The upward revenue revisions could be weaker dollar related, (weaker dollar is a plus as we learned from October ’14 through March ’15, when the US dollar soared a record amount in 6 months time, and listened to management’s whine about “f/x” and “constant currency” in the Q1 ’15 conference calls) but it could also be due to faster overall business growth expected, that we don’t yet see in GDP. Remember these bottom-up forecasts are one of the best leading indicators we have for forward stock prices and the EPS and revenue estimates take a LOT of variables into consideration.
The other aspect to this analysis readers need to remember is that “normally” the pattern is DOWNWARD or negative EPS and revenue revisions as we begin to track future quarters. Estimates normally start high and get revised lower until just prior to a quarter reporting and then the estimates start to turn higher.
The fact that we as investors are seeing HIGHER revisions today is very much a positive.
Tech, Basic Materials, Industrials – there is definitely a cyclical component to what revenue revisions are telling us.
Factset has some good data as well – more to come on Wednesday. Don’t want to overload readers.
The Street is turning more bullish on 2017 S&P 500 revenue growth in general – definitely not a bad sign.
