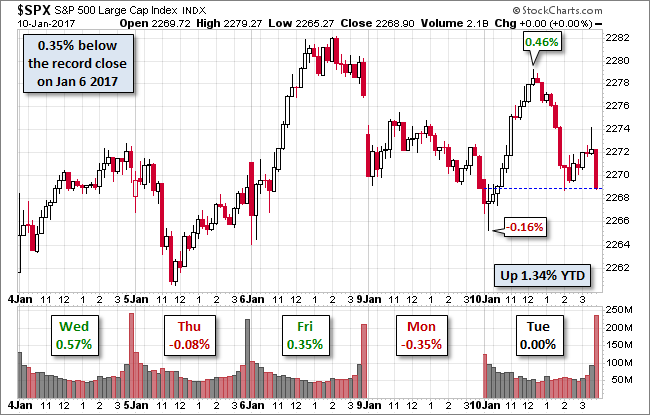
The S&P 500 stuttered at the open, hitting its -0.16% intraday low about 20 minutes into the session. It then rallied smoothly to its 0.46% noon hour high before smoothly selling off to the flat line. A week bounce in the final hour failed, and the index closed at exactly the same price as yesterday's close, a flat finish ... literally!
Here is a snapshot of the past five sessions (note: our Stockcharts.com source offered no response to our query about the missing intraday volume yesterday).
The yield on the 10-year note closed at 2.38%, unchanged from the previous close.
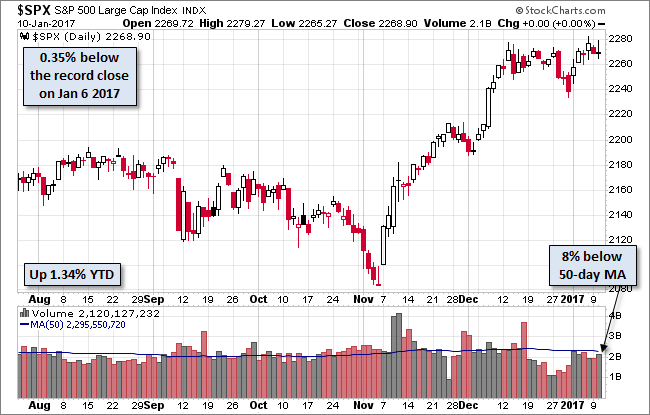
Here is a daily chart of the index. Volume ticked up a bit on Tuesday's trade but remains on the light side. Investors are apparently waiting on earnings and further evidence of Trumponomics before committing to a more definitive buy/sell decision.
A Perspective on Drawdowns
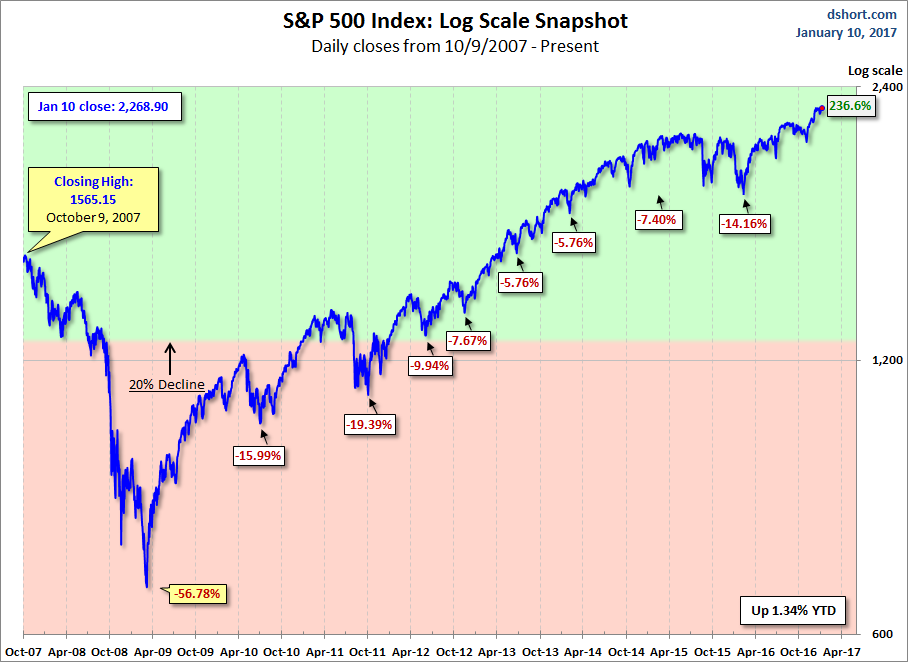
Here's a snapshot of record highs and selloffs since the 2009 trough.
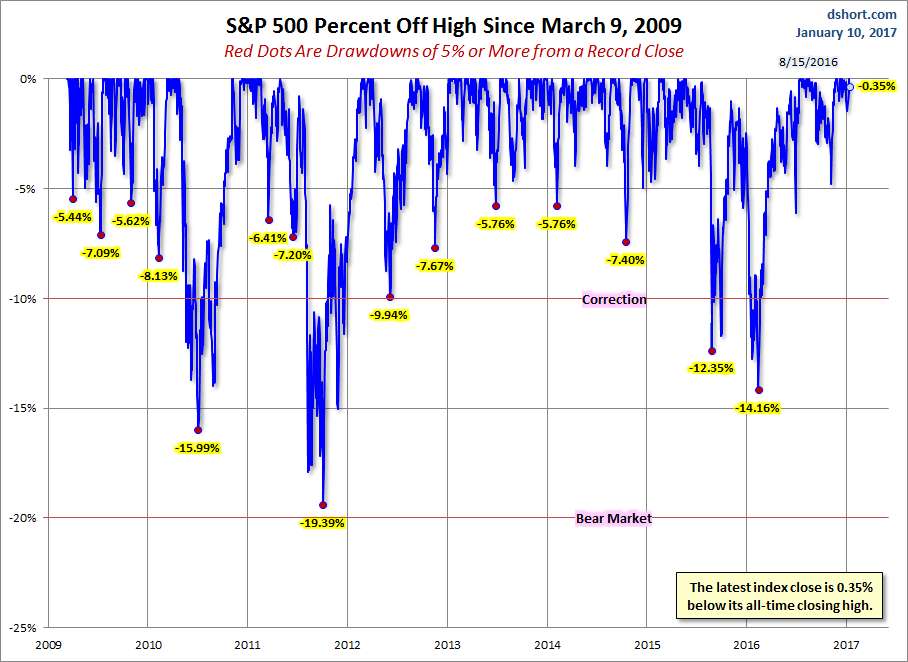
Here is a more conventional log-scale chart with drawdowns highlighted.
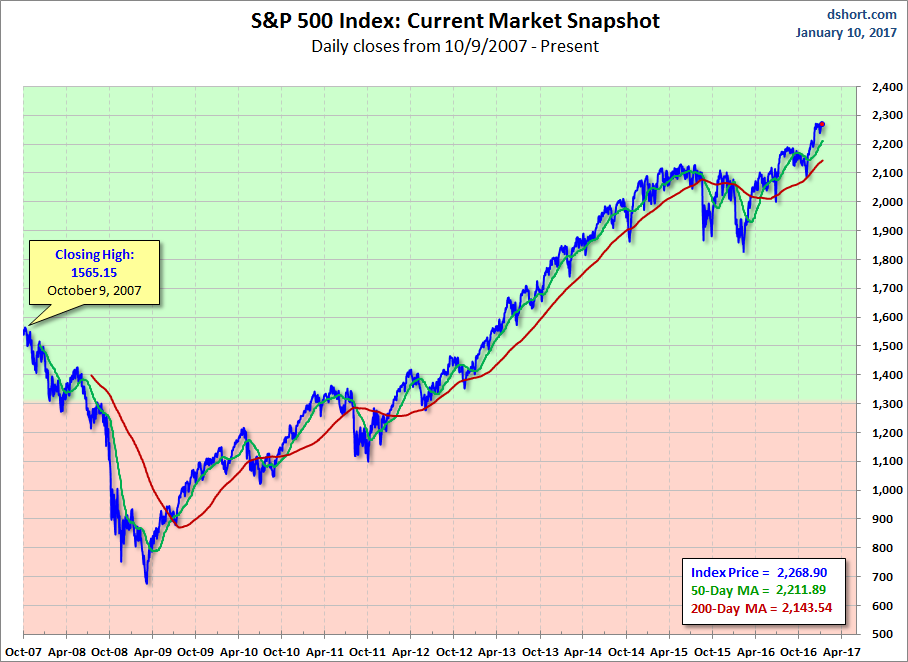
Here is a linear scale version of the same chart with the 50- and 200-day moving averages.
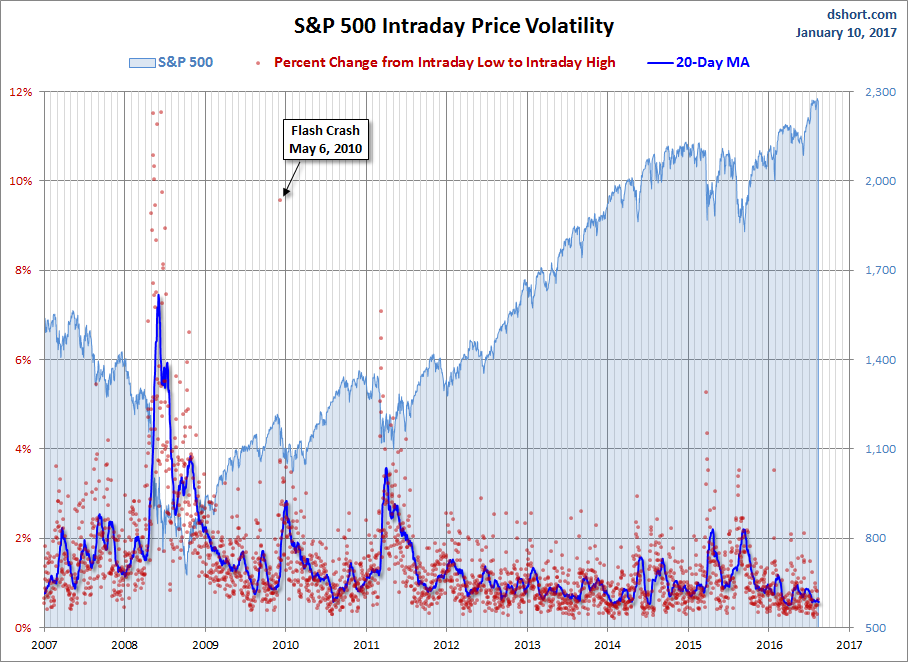
A Perspective on Volatility
For a sense of the correlation between the closing price and intraday volatility, the chart below overlays the S&P 500 since 2007 with the intraday price range. We've also included a 20-day moving average to help identify trends in volatility.
