The current contraction of the markets was unforeseen in my view of events of 2016. Mild corrections OK. Large upward or downward movements possible but not probable. This is NOT a good start to 2016.
Follow up
In my old forecast for 2016, I believed the markets were over-valued - but not significantly enough to trigger a significant revision. I believed the boyz could use their tool box to keep the markets relatively stable until economic conditions could catch up to valuations.
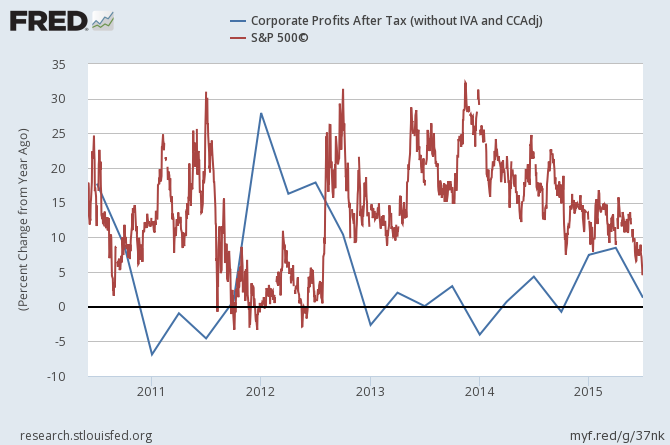
So what is going on? Maybe too many trends were not good - such as corporate earnings. Maybe 2 years of little corporate profit growth was the trigger?
Maybe it was news from China - economic slowing and currency valuation. China was expected to be a significant driver of the global economy - and now their currency has weakened to levels seen 5 years ago.
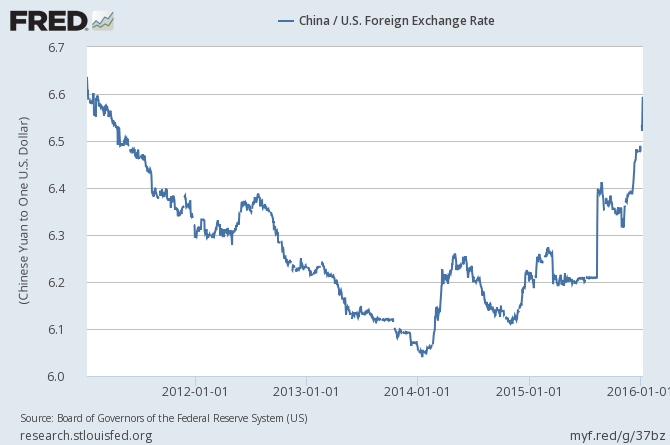
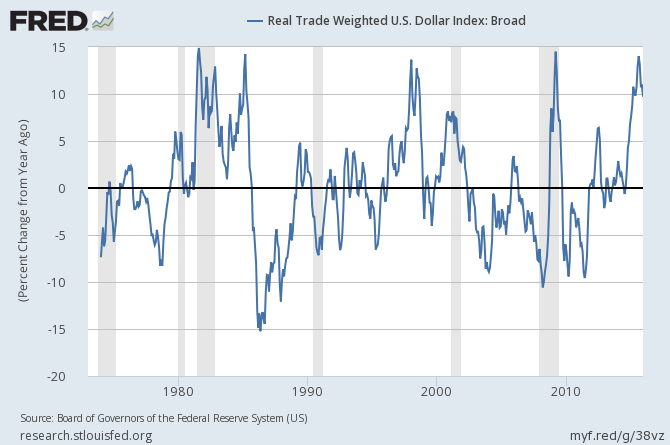
Maybe the US economy which was boosted by the constant devaluation of the dollar for most of the 21st century - is now faced with the deflationary pressure of a surging dollar. Deflation is one thing the economic masters do NOT know how to manage. Worse, a surging dollar will call home all dollar based loans. The rate of dollar appreciation means a dollar loan repayment grew 10% last year. Unfortunately, emerging economies will be crushed by dollar based loans . Further, global economy expressed in dollars will have a significant headwind if the dollar continues to strengthen.
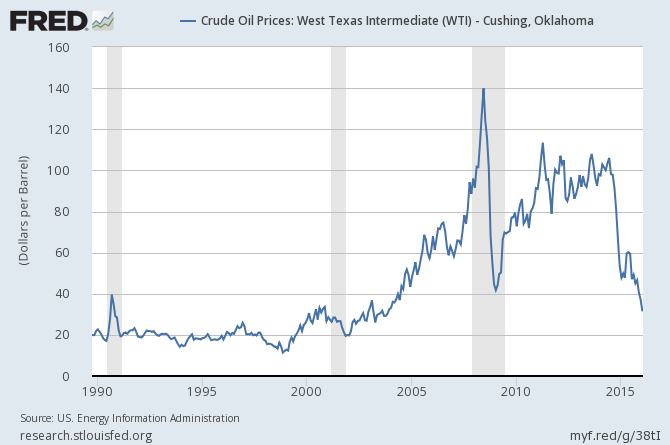
Maybe it is the deflationary pressure of the collapse of global oil prices. The world is returning to the good old days of cheap oil. This is an alternative fuels / energy killer - as well as a killer of processes / jobs based on alternative technologies.
Maybe it was the end of QE. I thought several statements made by Hoisington Asset Management were on target.
... QE works by a "signaling effect" rather than by any actual policy operations. Event studies show QE is viewed positively, while the removal of QE is viewed negatively. Thus, market participants believe QE puts a floor under financial asset prices. Central bankers might not intend to be providing downside insurance to the securities markets, but that is the widely held judgment of market participants. But, "No such protection is offered for real assets, never mind the real economy." Thus, the central bank operations boost financial asset returns relative to real asset returns and induce the shift away from real investment.
Additional empirical evidence, cited by Spence and Warsh, supports these fundamental arguments. From 2007 to 2014 gross private investment registered extremely substandard growth. Growth in nonresidential fixed investment fell substantially below the last six post-recession expansions. Spence and Warsh calculate that S&P 500 companies spent considerably more of their operating cash flow on financially engineered buybacks than on real capital expenditures in 2014; this has not happened since 2007. According to them, during the past five years, earnings of the S&P 500 have grown about 6.9% annually, versus 12.9% and 11.0%, respectively, from 2003-2007 and 1995-1999. Inadequate real investment means demand for labor is weak. Productivity is poor, which in turn, diminishes returns to labor. According to a Spence and Warsh op-ed article in the Wall Street Journal (Oct. 26, 2015):
"... only about half of the profit improvement in the current period is from business operation; the balance of earnings-per-share gains arose from record levels of share buybacks. So the quality of earnings is as deficient as its quantity."
The current market decline lowers my forecast of the 2016 economy from mediocre to flat at best. The reason is wealth affect. As I have stated in past posts, it is the upper quartile of the economy which owns stocks that drive the economy. This quartile is buying goods and services while the lower quartiles are simply in a survival mode spending all their income with little ability to expand spending.
The graph below shows the general correlation between the market valuation and economic growth. Down markets generally retard economic growth primarily by removing wealth.

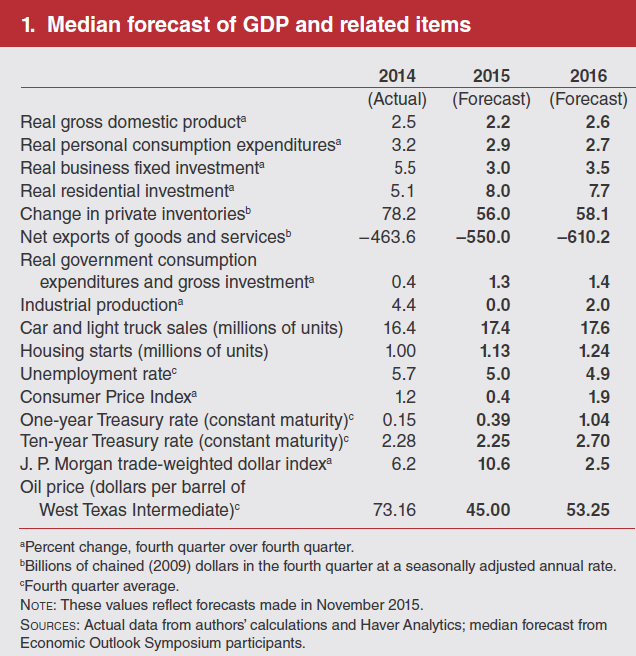
Yet, on Wednesday of this past week - another 2016 economic forecast was released. Does anyone really put any stock into economic forecasts?
I do not know why, but the rapid rise of the markets following the Great Depression and its difficulty now in 2016 brings the lyrics of Don Mclean's Bye Bye Miss American Pie to mind. Nothing remains good and wonderful forever.
A long, long time ago
I can still remember how that music used to make me smile
And I knew if I had my chance
That I could make those people dance
And maybe they'd be happy for a while
But February made me shiver
With every paper I'd deliver
Bad news on the doorstep
I couldn't take one more step
I can't remember if I cried
When I read about his widowed bride
But something touched me deep inside
The day the music died
Other Economic News this Week:
The Econintersect Economic Index for January 2016 declined - and is now at the lowest value since the end of the Great Recession. The tracked sectors of the economy which showed growth were mostly offset by the sectors in contraction.Our economic index remains in a long term decline since late 2014.
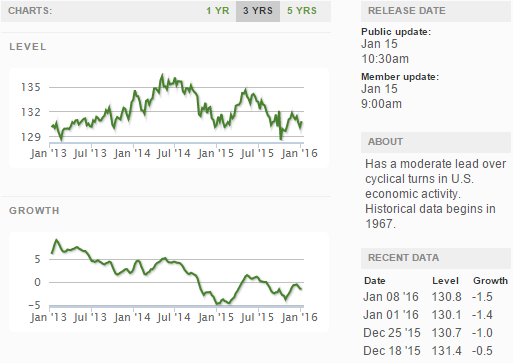
Current ECRI WLI Growth Index
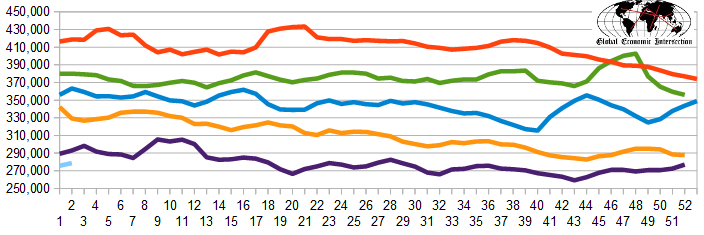
The market (from Bloomberg) was expecting the weekly initial unemployment claims at 270 K to 310 K (consensus 275,000) vs the 284,000 reported. The more important (because of the volatility in the weekly reported claims and seasonality errors in adjusting the data) 4 week moving average moved from 275.750 (reported last week as 275.750) to 278.750. The rolling averages generally have been equal to or under 300,000 since August 2014.
Weekly Initial Unemployment Claims - 4 Week Average - Seasonally Adjusted - 2011 (red line), 2012 (green line), 2013 (blue line), 2014 (orange line), 2015 (violet line)
Bankruptcies this Week: Arch Coal, Privately-held Sherwin Alumina and Sherwin Pipeline, Primorsk International Shipping Limited, Netherlands-based Metinvest (chapter 15)
Click here to view the scorecard table below with active hyperlinks
Weekly Economic Release Scorecard:
