I know you’re struggling to find cheap stocks to buy these days (or at least stocks that aren’t cheap for a reason!). This pullback is a bit helpful, but not enough for us dividend investors—the average S&P 500 stock yields a pathetic 1.7% as I write this.
That’s nowhere near enough dividend income to retire on, unless you’re sitting on a portfolio $2.5 million or more!
But don’t worry, there are always bargain-priced dividends out there—we just have to go a step beyond what the mainstream crowd is buying. Today I’m going to show you one such investment; it’s my favorite one to buy for big dividends and upside. I’m talking about closed-end funds (CEFs).
4X More Dividends, Predictable Price Gains
The best thing about CEFs? Big dividends. There are about 500 of these funds in existence, boasting an average yield of just over 7%. That’s four times more than what the typical S&P 500 stock pays.
And many CEFs pay 8% and up, so you can get a livable income stream on a lot less than $2.5 million. A $500K investment in a portfolio of CEFs yielding 8%, for example, will get you a tidy $40,000 in yearly dividend income.
Plus, if you love monthly dividends (who doesn’t—matching your payouts with your bills only makes sense), CEFs are for you: about 380 of these funds pay monthly.
A 1-Stop Bargain Indicator
That brings me to the bargains available in CEF-land. One thing people often overlook with CEFs is the upside they offer and how easy it is to tell if a CEF is a bargain that could be poised for a big run higher.
This is, by the way, one of the most frustrating things about investing in regular stocks (besides the low dividends!). How do you really tell if they’re bargains? Do you look at the trailing-12-month P/E ratio? The forward P/E ratio? The price-to-sales ratio? The PEG ratio?
This is no problem with CEFs: the only indicator you need is the discount to net asset value (NAV, or the per-share value of the investments in the fund’s portfolio). This stat is readily available on any CEF screener worth its salt.
The best way to show the discount to NAV in action is with an example, so let’s do that with a well-established CEF, the Liberty All Star Equity Fund (NYSE:USA), which has been around since 1986.
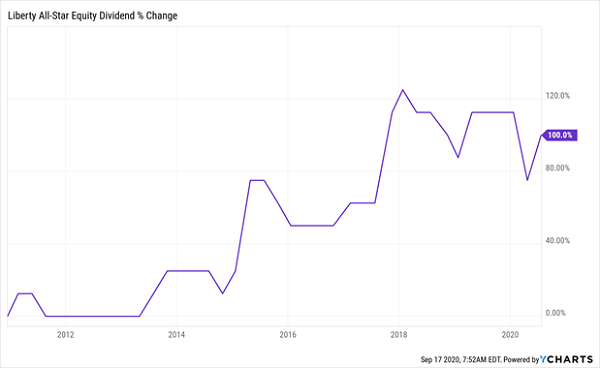
I’m going to come right out and say that this fund deserves to be on your watch list, due to its regular periods of outperformance and its massive dividend: USA yields 10.5% today, and its payout has more than doubled in the last decade (with some ups and downs, as management pledges to pay out 10% of the fund’s NAV as dividends annually).
USA: A 10.5% Dividend That Doubles
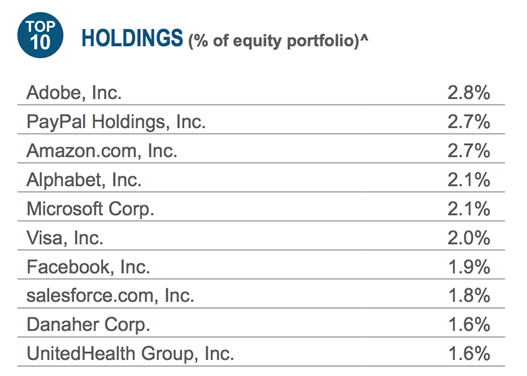
USA, as its ticker suggests, focuses on US stocks. The fund has a clear tech bent. Top-10 holdings include Amazon (NASDAQ:AMZN), Alphabet (NASDAQ:GOOGL) and Microsoft (NASDAQ:MSFT), as well as non-tech names like Visa (NYSE:V) and UnitedHealth Group (NYSE:UNH).
This is where the discount to NAV comes in.
Like all CEFs, USA isn’t allowed to issue new shares to new investors. That’s a critical difference between CEFs and their ETF and mutual-fund cousins.
It basically means that a CEF’s market price and NAV can diverge wildly: we can see that with USA—since inception, the fund has traded at discounts as deep as 24% and premiums as high as 20%. That’s a 44% spread—a huge range!
USA’s Incredible Vanishing (and Reappearing) Discount
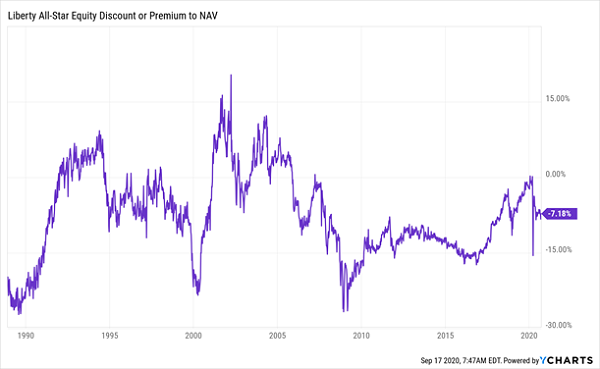
I’m sure you see the opportunity here: we simply wait till we can buy a CEF at an unusual discount, then buy—and profit as that discount reverts to a more normal level, propelling the share price higher as it does.
Compare that to USA’s ETF “cousin,” the SPDR S&P 500 ETF Trust (ASX:SPY), the ETF everyone uses as a benchmark for the S&P 500. SPY’s price is always more or less the same as its NAV.
ETFs: Never on Sale
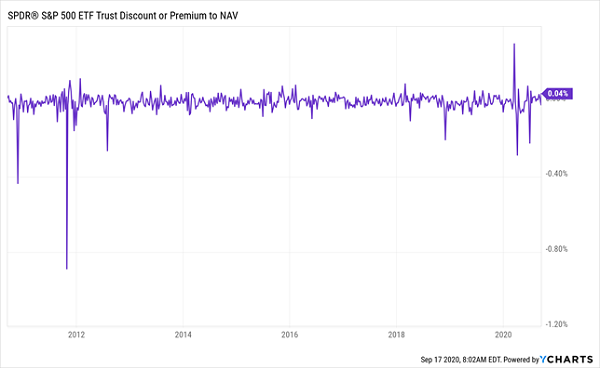
As you can see, even in a crisis, SPY’s discount is barely perceptible—less than 1%!
In other words, with a CEF like USA, we can buy many of the same stocks SPY holds, but at a discount (the fund trades at a 7% discount as I write this), versus always being forced to buy at par with SPY!
Now let’s close the loop with USA, and see just how potent a closing discount to NAV can be.
How USA Rode A Vanishing Discount To A Fast 68% Return
Let’s rewind to early November 2016, when USA hit a totally unusual 17% discount. From then until late September 2018, that discount bubbled away, until the fund was trading just 2% below its portfolio value.
USA’s Discount Window Closes …
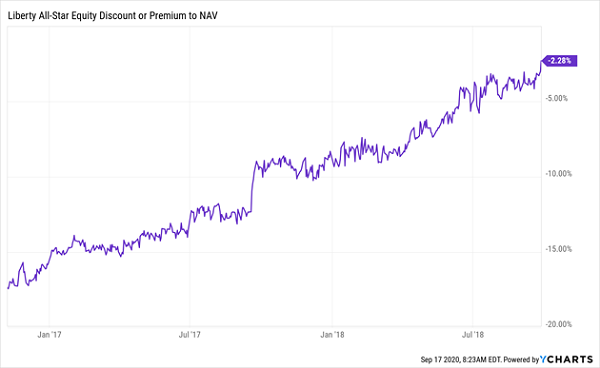
That disappearing discount put a steady updraft under USA’s share price, keeping it ahead of SPY for that entire time.
… And Pulls Its Price Past the Market
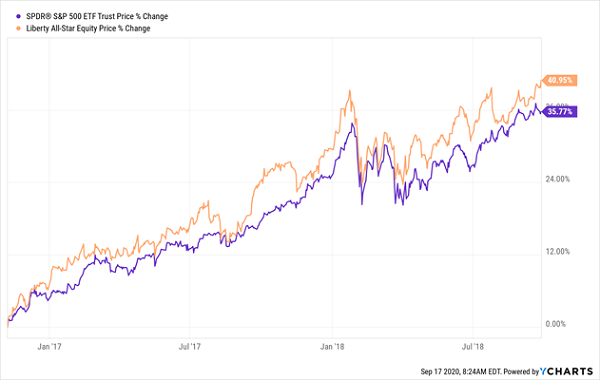
I know what you’re thinking: “Brett, that’s a pretty narrow gap between SPY and USA.”
You’d be right. But remember that this chart shows the fund’s market-price gain only. This highlights another mistake many folks make with CEFs: judging them by their price movements alone. But because CEFs give us most of our profits as dividends, we need to look at total returns, or the combination of dividends and price upside we get from the fund.
And when we add USA’s big dividend to the picture, the gap gets a lot wider:
Clobbering The Market, With 40% Of Your Gain In Cash
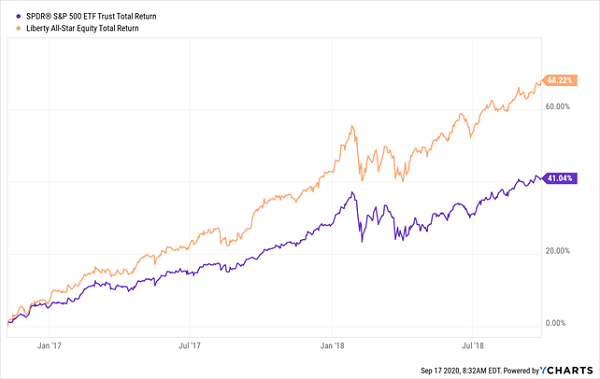
I think you’ll agree that crushing the market and getting 40% of your return in cash is a pretty sweet deal. And these days, a 10.5% dividend that can help pay our bills is a godsend.
So where does that leave USA now? At a 7% discount to NAV, it’s certainly not the bargain it was a few years ago.
However, that discount is still better than the 5% discount the CEF has averaged in the past year, so we can expect some upside courtesy of USA’s discount. But I’d hold off on buying for now, at least until we see that discount drop back to double digits.
Disclosure: Brett Owens and Michael Foster are contrarian income investors who look for undervalued stocks/funds across the U.S. markets. Click here to learn how to profit from their strategies in the latest report, "7 Great Dividend Growth Stocks for a Secure Retirement."
