Clowns to the left of me,
Jokers to the right, here I am,
Stuck in the middle with you – Steelers Wheel
The lyrics seem apropos considering we have Trump, China, Mnuchin, the Fed, along with a whole cast of colorful characters making managing money a difficult prospect recently.
However, the good news is that over the last month, the bulls have had their wish list fulfilled.
If you are a bull, what is there not to love?
However, as I noted in this past weekend’s newsletter.
“Despite all of this liquidity and support, the market remains currently confined to a downtrend from the September highs. The good news is there is a series of rising lows from June. With a ‘risk-on’ signal approaching and the market not back to egregiously overbought, there is room for the market to rally from here.”
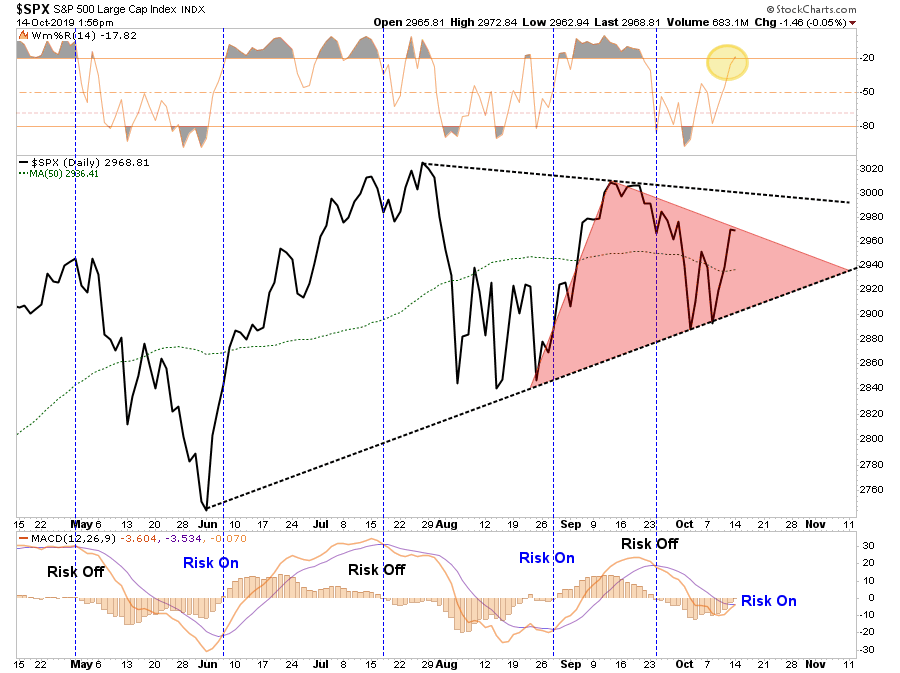
As the tug-of-war between the “bulls” and “bears” continues, the toughest challenge continues to be understanding where we are in the overall market process. The bulls argue this is a “consolidation” process on the way to higher highs. The bears suggest this is a “topping process” which continues to play out over time.
As investors, and portfolio managers, our job is not “guessing” where the market may head next, but rather to “navigate” the market for what is occurring.
This is an essential point because the majority of investors are driven primarily by two psychological behaviors: herding and confirmation bias. (Read this for more information.)
Since the market has been in a “bullish trend” for the last decade, we tend to only look for information that supports our “hope” the markets will continue to go higher. (Confirmation Bias)
Furthermore, as we “hope” the market will go higher, we buy the same stocks everyone else is buying because they are going up. (Herding)
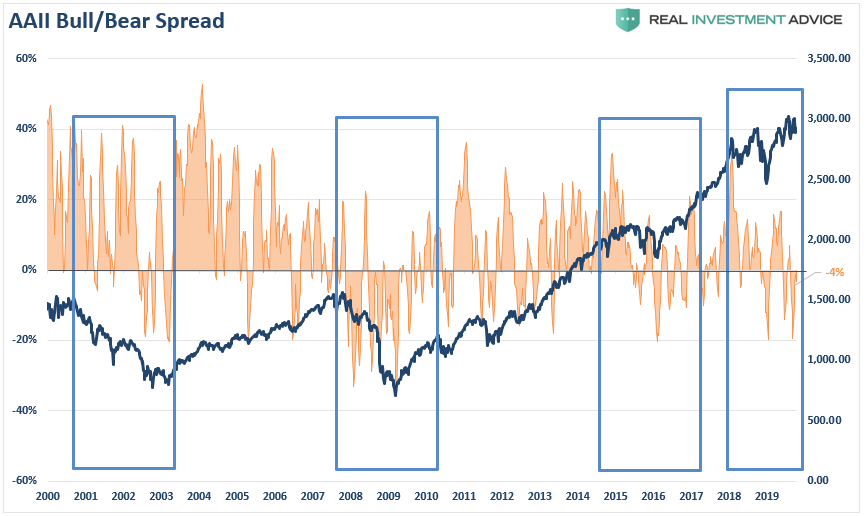
Here is a perfect example of these concepts in action. The chart below shows the 4-week average of the spread between bullish and bearish sentiment according to the respected AAII investor survey. Currently, investors are significantly bearish, which has historically been an indicator of short-term bottoms in the market. (contrarian indicator)
If you assumed that with such a level of bearishness, most investors would be sitting in cash, you would be wrong. Over the last couple of months as concerns of trade, earnings, and the economy were brewing, investors actually “increased” equity risk in portfolios with cash at historically low levels.
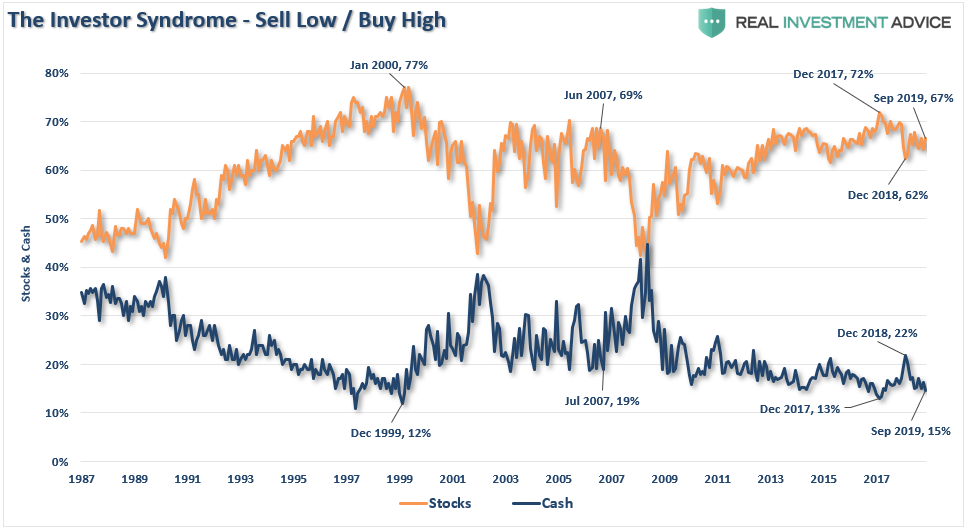
This is a classic case of “bull market” conditioning.
We can also see the same type of “bullish” positioning by looking at Rydex mutual funds. The chart below compares the S&P 500 to various measures of Rydex ratios (bear market to bull market funds)
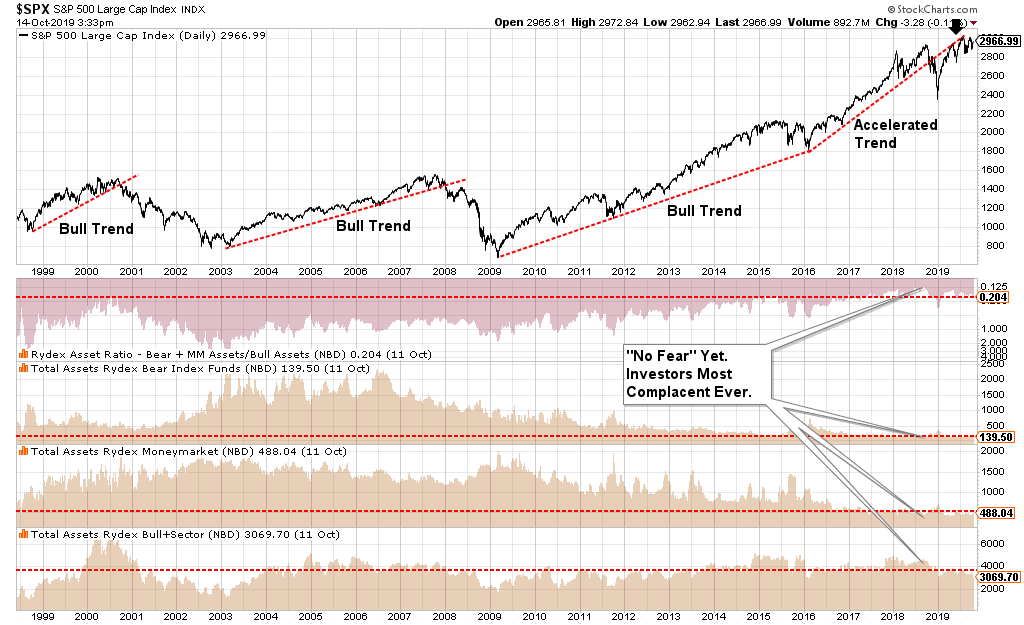
Note that during the sell-off in December 2018, the move to bearish funds never achieved the levels seen during the 2015-2016 correction. More importantly, the snap-back to “complacency” has been quite astonishing.
While investors are “very concerned” about the market (ie bearish in their sentiment) they are unwilling to do anything about it because they are afraid of “missing out” in the event the market goes up.
Therein lies the trap.
By the time investors are convinced they need to sell, the damage has historically already been done.
Stuck In The Middle
Currently, the market is continuing to wrestle with a rising number of risks. My friend and colleague Doug Kass recently penned a nice laundry list:
- The Fed Is Pushing On A String: A mature, decade old economic recovery will not likely be revived by more rate cuts or by lower interest rates. The cost and availability of credit is not what is ailing the U.S. economy. Market participants are likely to lose confidence in the Fed’s ability to offset economic weakness in the year ahead.
- Untenable Debt Loads in the Private and Public Sectors:Katie Bar The Doors should rates rise and debt service increase. (As I noted all week, the corporate credit markets are already laboring and, in some cases, are freezing up).
- An Unresolved Trade War With China: This will produce a violent drop in world trade, a freeze in capital spending, and a quick deterioration in business and consumer sentiment.
- The Global Manufacturing Recession Is Seeping Into The Services Sector:After years of artificially low rates, the consumer is no longer pent up and is vulnerable to more manufacturing weakness.
- The Market Structure is Frightening: The proliferation of popularity of ETFs when combined with quantitative strategies (e.g., risk parity) have everyone on the same side on the boat and in the same trade (read: long). The potential for a series of “Flash Crashes” hasn’t been so high as since October, 1987.
- We Are at an All Time Low in Global Cooperation and Coordination: In our flat and interconnected world, what happens to global economic growth when the wheels fall off?
- We Are Already In An “Earnings Recession”: I expect a disappointing 3Q reporting period ahead. What happens when the rate of domestic and global economic growth slows more dramatically and a full blown global recession emerges?
- Front Runner Status of Senator Warren: Most view a Warren administration as business, economy and market unfriendly.
- Valuations on Traditional Metrics (e.g., stock capitalizations to GDP) Are Sky High: This is particular true when non GAAP earnings are adjusted back to GAAP earnings!
- Few Expect That The Market Can Undergo A Meaningful Drawdown:There is near universal belief that there is too much central bank and corporate liquidity (and other factors) that preclude a large market decline. It usually pays to expect the unexpected.
- The Private Equity Market (For Unicorns) Crashes and Burns: Softbank is this cycle’s Black Swan.
- WeWork’s Problems Are Contagious: The company causes a massive disruption in the U.S. commercial real estate market.
Don’t take this list of concerns lightly.
The market rallied from the lows of December on “hopes” of Fed rate cuts, QE, and a “trade deal.” As we questioned previously, has the fulfillment of the bulls “wish list” already been priced in?However, since then, the market has remained stuck within a fairly broad trading range between previous highs and the 200-dma.
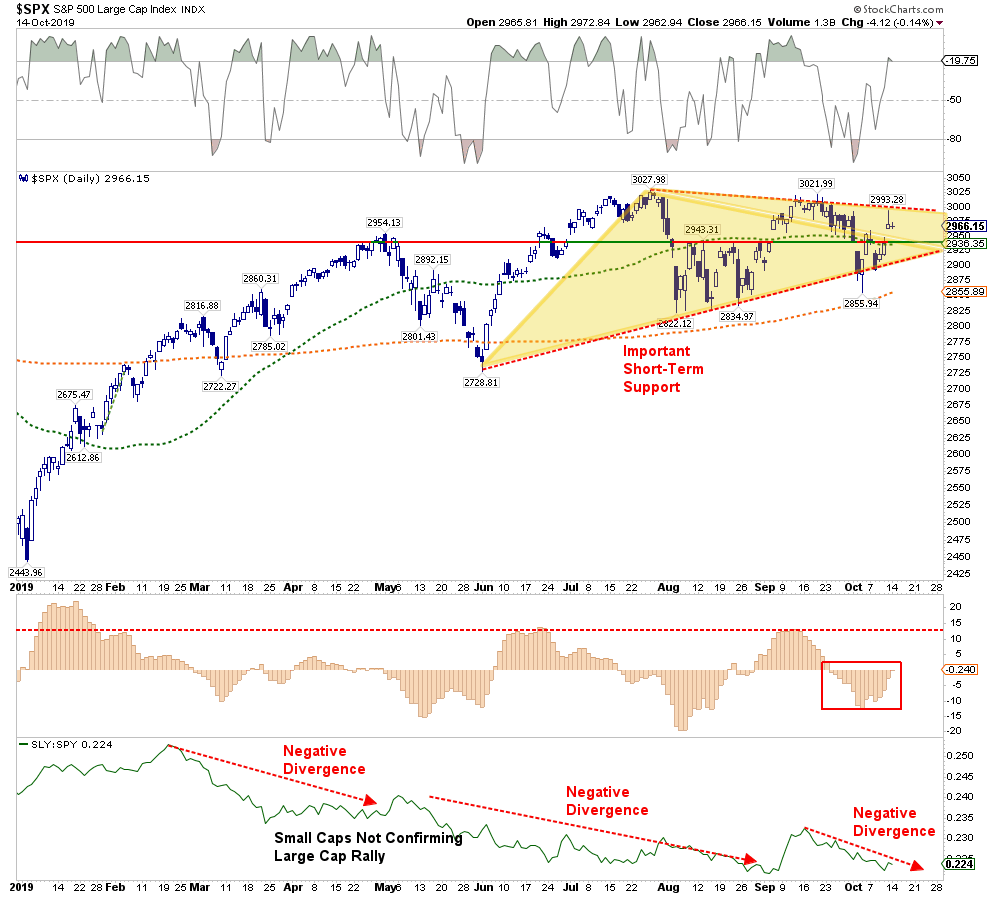
Notice the negative divergence between small-capitalization companies and the S&P 500. This is symptomatic of investors crowding into large-cap, highly liquid companies, as they are “fearful” of a correction in the market, but are “more fearful” of not being invested if the market goes up.
This is an important point when managing money. The most important part of the battle is getting the overall “trend” right. “Buy and hold” strategies work fine in rising price trends, and “not so much” during declines.
The reason why most “buy and hold” supporters suggest there is no alternative is because of two primary problems:
- Trend changes happen slowly and can be deceptive at times, and;
- Bear markets happen fast.
Since the primary messaging from the media is that “you can’t miss out” on a “bull market,” investors tend to dismiss the basic warning signs that markets issue. However, because “bear markets” happen fast, by the time one is realized, it is often too late to do anything about it.
The chart below is one of my favorites. It is a quarterly chart of several combined indicators which are excellent at denoting changes to overall market trends. The indicators started ringing alarm bells in early 2018, when I begin talking about the end of the “bull market” advance. However, that correction, as noted, was quickly reversed by the Fed’s changes in policy and “hopes” of an impending “trade deal.”
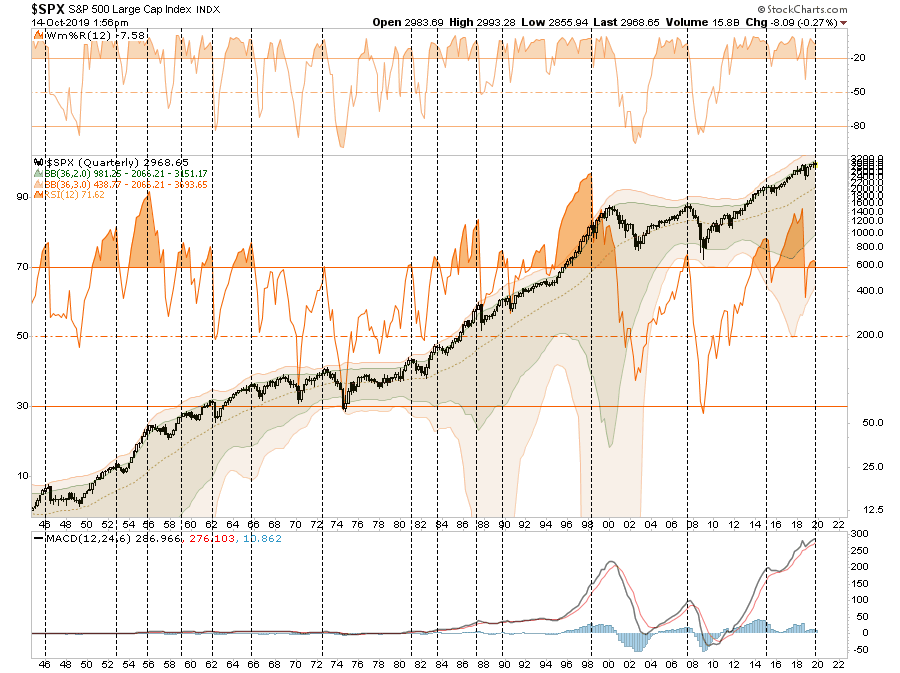
Unfortunately, what should have been a larger corrective process to set up the next major bull market, instead every single indicator has reverted back to warning levels.
If the bull market is going to resume, the market needs to break above recent highs, and confirm the breakout with expanding volume and participation in both small and mid-capitalization stocks which have been sorely lagging over the past 18-months.
However, with earnings and economic growth weakening, this could be a tough order to fill in the near term.
So, for now, with our portfolios underweight equity, over-weight cash, and target weight fixed income, we remain “stuck in the middle with you.”
