Investing.com’s stocks of the week
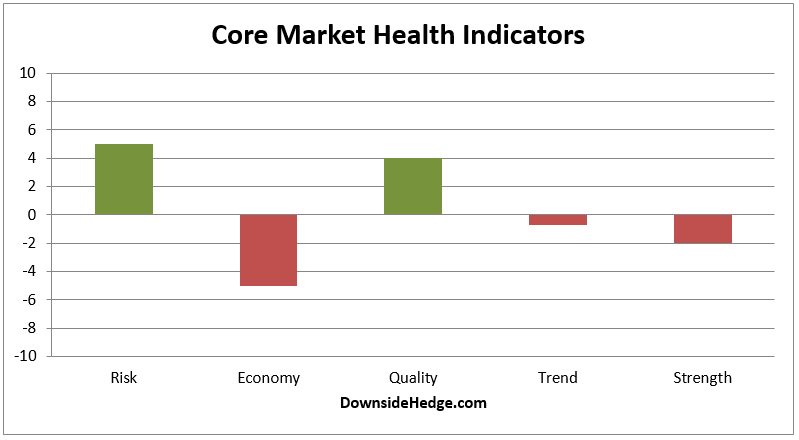
Over the past week, my core market health indicators bounced around a bit. They are mostly showing short term weakness, but longer term strength. This usually means the market should resolve higher.
One thing of particular note is that my core measures of risk are deteriorating rapidly. This isn’t a normal occurrence near all time highs. The last time this occurred was in February of 2015 which was followed by several months of choppy movement, then a decent decline. This isn’t a prediction, just an observation and something to watch.

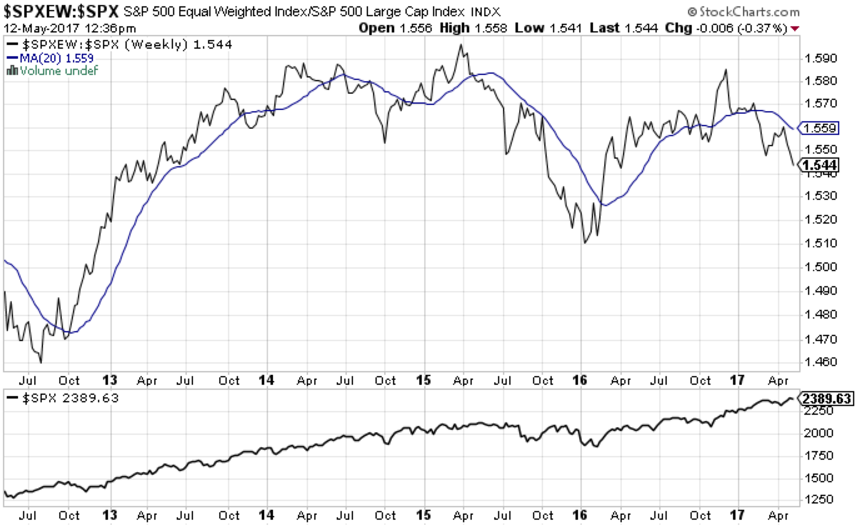
Another thing I’m watching closely is various measures of breadth. The most significant at the moment is the ratio between the (S&P 500 Equal Weighted) and the S&P 500 Index (SPX). When it is below its 20 week moving average the market usually chops around (at the least). This is exactly what we’ve seen since it fell below the line in early February.

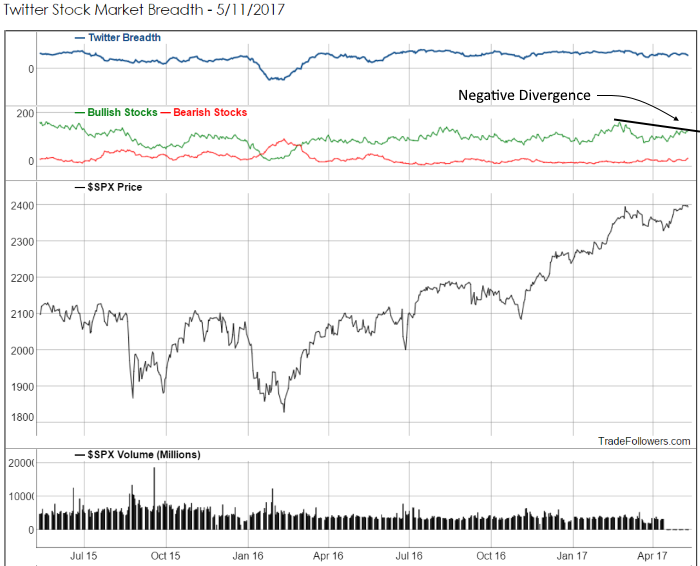
Another measure of breadth comes from the number of bullish stocks on the Twitter stream. This indicator is painting a negative divergence which indicates traders on Twitter aren’t aggressively pushing and buying as many stocks today vs. the last time SPX was near 2400.

Conclusion
The market is trying to break out, but breadth isn’t improving. This condition often results in a choppy market. If the market can break out then bulls want to see breadth improve or we risk a good size decline when the rally ends.