The direction of prices in the stock market has caused angst for many over the last 4 months. Is the market going to crash like the prominent bearish leaning pundits have been telling us for years? It dropped 10%, maybe that is just the beginning. Or is it going to snap back and rush to new all-time highs. In fact the Russell 2000 has done that already, but the broader market is still a long way off of new highs. The debate has caused for many heated arguments among pundits (that is not new), in the press and even between clients and advisors.
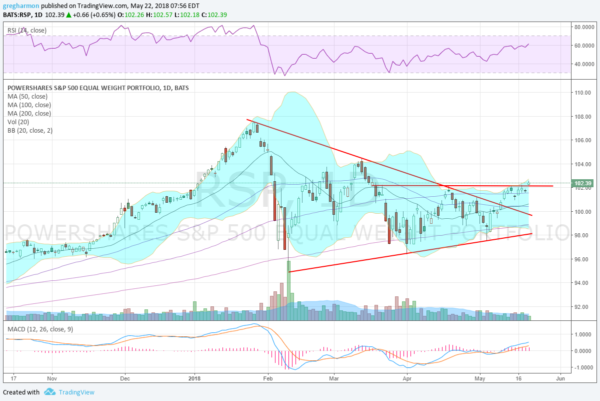
There will not be a definitive answer as to which direction the market is headed until it either makes new lows or new highs. Until then it is a sideways consolidation. But there are indications of where it might be headed. The first is that the Russell 2000 is at all-time highs. That is a positive. Another is the breadth of strength in individual names. It is often hard to see this as you can also find a lot of losing stocks. But one way to see how wide the net is expanding in positive stocks is to look at the equal weighted S&P 500, RSP.
 The simple chart of the equal weight S&P 500 above is telling. First it shows the tightening consolidation since the beginning of February, like the other indexes. But it also shows a break of that consolidation 2 weeks ago, and a higher high close Monday. It also shows momentum building in both the RSI which is now over 60 in the bullish zone, and the MACD rising and positive. The Bollinger Bands® are also turning higher, allowing a move up. A move over the March high will seal the deal for a positive build. Until then keep watching the improvement.
The information in this blog post represents my own opinions and does not contain a recommendation for any particular security or investment. I or my affiliates may hold positions or other interests in securities mentioned in the Blog, please see my Disclaimer page for my full disclaimer.
