According to the latest weekly economic survey released by the Central Bank of Brazil (BCB) on Monday, market consensus growth estimate declined from -1.50% to -1.70% for 2015 and from 0.50% to 0.33% from 2016 as bad news keeps piling up. Inflation expectations for 2015 continue to rise as IPCA is expected at 9.15% by year-end. However, on the bright side, the BCB’s efforts to curb inflation seem successful as median estimate for 2016 eased to 5.40% from 5.44% a week earlier.
All in all, we expect the Brazilian economy to contract more than expected as the world’s seventh biggest economy is suffering from high interest rate, falling commodity prices and ongoing corruption investigations. After a promising start in 2015, President Rousseff struggles to pass unpopular austerity measures as she lost support from both the President of the Senate, Renan Calheiros, and the President of the Chamber of Deputies, Eduardo Cunha. Investors are now losing faith in President Rousseff’s ability to curb government budget deficits and to maintain Brazil’s investment grade. As a consequence, the risk embedded in Brazilian assets increased significantly: USD/BRL gained upside momentum and added 2.5% since mid-July while the Ibovespa lost 3.4% over the same period. Brazil investment credit rating is clearly at stake but it is not too late to avoid a downgrade. However given the actual political crisis and the rebellion of key lawmakers, the odds of a credit rating downgrade by Moody’s have increased significantly.
Oil collapses below $50 a barrel
Yesterday, WTI crude oil price collapsed below $50 a barrel, a level unseen since April 6 which is close to its lowest level this year.
Crude oil price is mainly driven lower by an excessive supply. OPEC is fighting to keep its market share and is currently maintaining a high production level to challenge the US oil shale industry. In addition it is difficult for this industry to make benefit below $70 a barrel. Around $50 a barrel, it becomes difficult for US oil producers to survive.
Furthermore, the nuclear agreement reached last week with Iran had an impact on crude oil prices. Indeed, Iran is decided to also regain market share and will oversupply the market regardless the price as its current reserves are massive, about 150 billion barrels. Nonetheless, no Iran’s exports are expected before next year and traders have already priced in the market its excess reserves. Hence, it is also worth saying that the United States are ready to sacrifice, for the time being, their oil shale industry in exchange of a better control of the middle-east area. As long as the dollar is used in international exchange, the US is able to control its massive debt. Therefore we think that the Iran huge reserves seem secondary for the US.
The oil market is oversupplied and this is not likely to stop. Even Saudi Arabia announced a June production record last week. We anticipate the WTI to target its year-low of around $42 a barrel. At this level, it seems nonetheless a good option to start reloading oil futures.
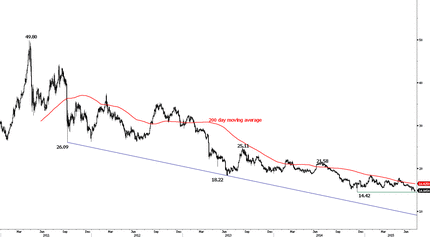
Silver - Holding Above Support at 14.42


The Risk Today
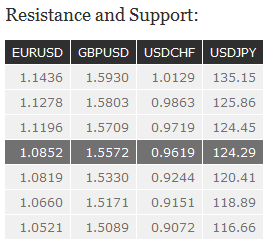
EUR/USD has broken support at 1.0819 (27/05/2015 low). Hourly resistance lies at 1.1278 (29/06/2015 high). Stronger resistance lies at 1.1436 (18/06/2015 high). In the longer term, the symmetrical triangle from 2010-2014 favors further weakness towards parity. As a result, we view the recent sideways moves as a pause in an underlying declining trend. Key supports can be found at 1.0504 (21/03/2003 low) and 1.0000 (psychological support). Break to the upside would suggest a test of resistance at 1.1534 (03/02/2015 reaction high).
GBP/USD is consolidating. Hourly resistance is given at 1.5803 (24/06/2015 high). Hourly support is given at 1.5330 (08/07/2015 low). Nonetheless, we expect the pair to decrease again within the next few days. In the longer term, the technical structure looks like a recovery bottom whose maximum upside potential is given by the strong resistance at 1.6189 (Fibo 61% entrancement).
USD/JPY has broken resistance at 124.45 (17/06/2015 high). Stronger resistance still lies at 135.15 (14-year high). Hourly support is given by the 38.2% Fibonacci retracement at 122.98. Stronger support is given at 120.41 (08/07/2015 low). A long-term bullish bias is favored as long as the strong support at 115.57 (16/12/2014 low) holds. A gradual rise towards the major resistance at 135.15 (01/02/2002 high) is favored. A key support can be found at 118.18 (16/02/2015 low).
USD/CHF has broken hourly resistance at 0.9543 (27/05/2015 high). Hourly support can be found at 0.9151 (18/06/2015 low). The road is now wide open for the pair to challenge stronger resistance at 0.9719 (23/04/2015 high). In the long-term, there is no sign to suggest the end of the current downtrend. After failure to break above 0.9448 and reinstate bullish trend. As a result, the current weakness is seen as a counter-trend move. Key support can be found 0.8986 (30/01/2015 low).

