Don’t call it a comeback, but stocks refuse to be put down.
The Dow Jones Industrial Average (DJIA) snapped a five-day slide last Friday as hopes for crude oil production cuts outweighed global recession fears. The DJIA closed up more than 300 points, or 2%.
Since then, all three major U.S. averages have made big gains.
Now, traders are feverishly hunting for confirmation of a downtrend reversal – essentially the green light to buy.
Last week, I introduced you to the “ascending triangle” chart pattern. You’ll recall this popular technical stock pattern often follows sharp selloffs, like we saw in January.
Today, I’m going to show you an even more important reversal pattern.
“W” Marks the Spot
When uncertainty looms, the dance between the bulls and bears can become violent.
Fear is contagious, which can drive sharp selloffs. Then, once the bears have exhausted themselves, the bulls rush in with force. Sometimes, that’s all it takes for an uptrend to resume course.
However, if the ensuing rally fails to find support along higher lows, a security will retest its recent low.
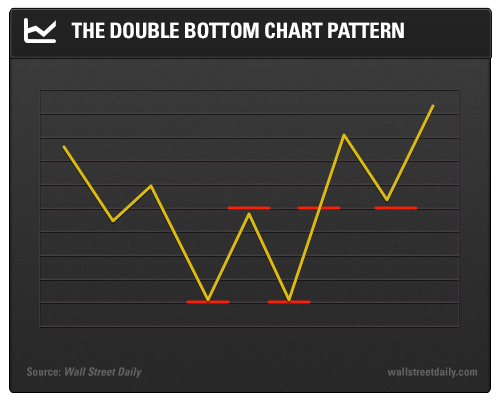
This price action often sets up what’s known as a double bottom chart pattern. And this key reversal pattern can be very profitable for observant traders.
Here’s what the pattern looks like:

Most traders will wait for a breakout above the double-bottom resistance line. If the resistance becomes support, then investors can take new positions and confidently expect more upside.
Aggressive traders might take a position on the second upswing, ahead of the retest of the double bottom high.
This approach is riskier, but it can be more profitable if the uptrend holds.
From a top-down perspective, the Dow and S&P 500 have both produced double bottom patterns after January’s vicious selloff.
Both indices are also on their way to re-testing January highs – the level of current double-bottom resistance. A breakout above this line for either index bodes very well for stocks over the next few months.
In the meantime, let’s take a look at a compelling stock on the verge of its own double bottom breakout.
“Kreme” of the Crop
One of America’s most recognizable food and beverage brands, Krispy Kreme Doughnuts Inc. (N:KKD) is known for its iconic doughnuts.
Founded in 1937, the company owns and operates more than 100 stores in 19 states across the country.
The company also has an additional 167 domestic franchised locations and 709 international franchises in 23 countries.
From the stock’s 2011 low, shares rallied 394% before peaking in 2013. Since then, shares have been stuck in a three-year downtrend and have fallen more than 40%. However, the tide has recently turned for Krispy Kreme, and momentum has swung to the upside.
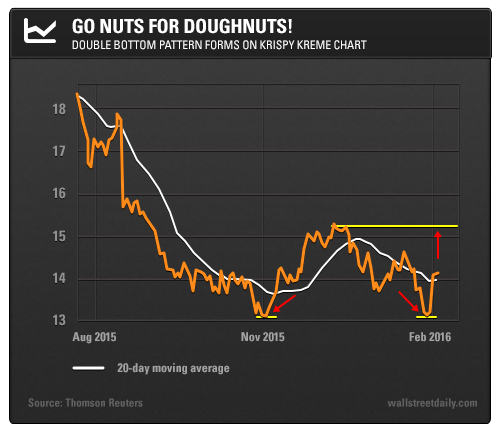
In fact, Krispy Kreme is set up in a clear double bottom pattern. From its 52-week low in November, shares rallied 16% in December then quickly fell to within 1% of the November low.

This week, shares broke above their January low and their 20-day moving average. A breakout above the pattern resistance around $15.30 would be a major buy signal.
As you can see, the double bottom pattern is a powerful tool for confirming trend reversals across asset classes. And it’s not just useful on daily charts – it can also help us spot reversals on weekly and monthly charts.
Be sure to add this chart pattern to your technical trading toolbox.
