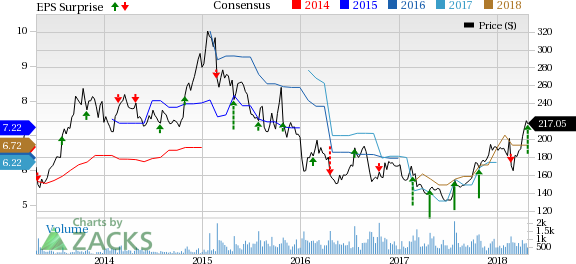
The Boston Beer Company, Inc. (NYSE:SAM) reported a solid first-quarter 2017 with both the top and bottom lines surpassing estimates. Notably, this marked its fifth earnings beat in the last six quarters and the third positive sales surprise in the trailing four quarters.
Q1 Highlights
Boston Beer’s first-quarter 2017 adjusted earnings per share of 55 cents topped the Zacks Consensus Estimate of 38 cents and moved up significantly from 17 cents earned in the prior-year quarter. The increase mainly stemmed from an improvement in net revenues as well as higher gross margin, somewhat negated by rise in advertising, promotion and selling expenses.
On a GAAP basis, earnings were 78 cents per share compared with 45 cents in the year-ago quarter.
Net revenues advanced nearly 17.8% year over year to $190.5 million, surpassing the Zacks Consensus Estimate of $172 million. Excluding excise taxes, the top line rose 17.1% year over year to $201.8 million, primarily driven by improved shipments volumes, which increased 15%. Additionally, depletions grew 8%.
In the reported quarter, depletion primarily gained from increases in Twisted Tea, Truly Spiked & Sparkling and Angry Orchard brands, partially offset by the fall in the Samuel Adams brand. Depletions for the year-to-date period through the 15-weeks period, ended Apr 14, 2018, are estimated to have grown nearly 8% from the comparable year-ago period.
Costs & Margins
Gross profit improved 26% year over year to $96.1 million while gross margin expanded 330 basis points to 50.5% in the quarter. The improvement can be attributed to better pricing, product and package mix, and favorable fixed-cost absorption along with cost-savings gains from the company-owned breweries. These were partly mitigated by increased ingredients and packaging expenses.
Furthermore, advertising, promotional and selling expenses increased 25.5% to $67.5 million, mainly owing to higher investments in media, point-of-sale and local marketing as well as increased freight to distributors on escalated rates and volumes.
General and administrative expenses grew 3.8% to $19.3 million, driven by higher salaries and benefit costs.
Financials
As of Mar 31, 2018, Boston Beer had cash and cash equivalents of $46.6 million and total stockholders’ equity of $436.9 million.
In the first quarter and the period between Apr 1 and Apr 20, Boston Beer bought back about 119,000 shares worth roughly $22.6 million. With this, it had nearly $156.1 million remaining under its $931-million share buyback authorization as of Apr 20, 2018.
Growth Plan
Management remains committed toward three-point growth plan. Firstly, it plans to revive the Samuel Adams brand through packaging, innovation, promotion and brand communication initiatives. Further, it remains keen on retaining Angry Orchard and Twisted Tea’s momentum while ensuring Truly Spiked & Sparkling's leadership position in the hard sparkling-water category. Efforts to improve trends at Samuel Adams comprise its latest 'Fill Your Glass' integrated marketing campaign alongside sales execution of its Samuel Adams initiative, Sam ’76. Additionally, the company is focused on making more investments in Angry Orchard media in the second quarter.
Second, the company is focused on accelerated cost savings and efficiency projects with savings directed for further brand development. Depending upon the opportunities in 2018, management has reiterated its gross margin expansion target, which is likely to grow on an average of one percentage point every year, through 2019.
Thirdly, management remains committed to long-term product innovations and maximizing the shareholder value. Boston Beer also remains optimistic about the craft beer and cider categories, going forward.
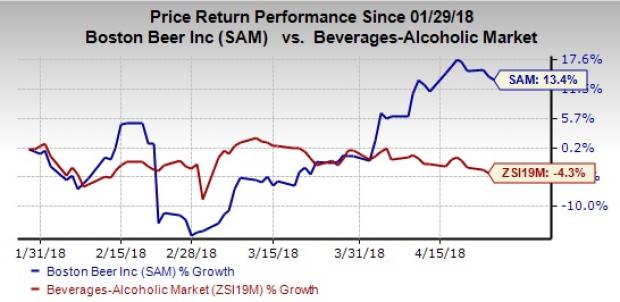
In the past three months, this Zacks Rank #3 (Hold) company’s shares have rallied 13.4% against the industry’s decline of 4.3%. We believe, these initiatives will aid in driving growth and retaining stock momentum, going forward.

Guidance
Management reiterated its outlook for 2018. For the year, earnings per share are envisioned between $6.30 and $7.30. This guidance is based on certain assumptions, including depletions and shipments in the range of flat-to-up 6%, price increases of 0-2% and gross margin expansion of 52-54%, owing to the progress on cost savings.
Moreover, investment in advertising, promotional and selling expenses is envisioned to increase $15-$25 million. Management anticipates general and administrative expenses to grow $10-$20 million, attributable to organizational investments and stock-compensation expenses.
Adjusted effective tax rate guidance is anticipated to be roughly 28%, excluding the impact of ASU 2016-09. Capital spending is still envisioned to be $55-$65 million for 2018, comprising of increased investments in breweries and tap rooms.
Looking for Solid Stocks, Check These
Some better-ranked stocks in the same industry include Ambev S.A. (NYSE:ABEV) , Heineken NV (OTC:HEINY) and Pernod Ricard (PA:PERP) SA (OTC:PDRDY) , each carrying a Zacks Rank #2 (Buy). You can see the complete list of today’s Zacks #1 Rank (Strong Buy) stocks here.
Ambev has long-term earnings growth rate of 23.8%. The stock has surged 16.4% in the past year.
Heineken has returned 16.4% in the past year. The stock has long-term earnings growth rate of 8.4%.
Pernod Ricard has long-term earnings growth rate of 7.5% while the stock has rallied 32.6% in the past year.
More Stock News: This Is Bigger than the iPhone!
It could become the mother of all technological revolutions. Apple (NASDAQ:AAPL) sold a mere 1 billion iPhones in 10 years but a new breakthrough is expected to generate more than 27 billion devices in just 3 years, creating a $1.7 trillion market.
Zacks has just released a Special Report that spotlights this fast-emerging phenomenon and 6 tickers for taking advantage of it. If you don't buy now, you may kick yourself in 2020.
Click here for the 6 trades >>
Heineken NV (HEINY): Free Stock Analysis Report
The Boston Beer Company, Inc. (SAM): Free Stock Analysis Report
Ambev S.A. (ABEV): Free Stock Analysis Report
Pernod Ricard SA (PDRDY): Free Stock Analysis Report
Original post
Zacks Investment Research

