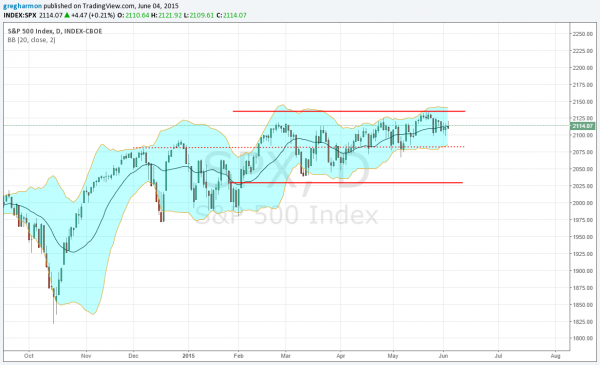
"The other important Fibonacci extensions, 150% and 161.8% are at 2029 and 2136. The high on the S&P 500 to date at 2093 falls short of the 161.8% extension, but the span from the 138.2% to 161.8% levels has developed a range for the present. A move over the top would signal the end of Wave (IV) and start of Wave (V)…."
I wrote that February 5 as part of the long-term outlook for the S&P 500. The conclusion then was that a range was developing and could last for a long time before a break, most likely to the upside.

Nothing has really changed in the broad market since then. There have been plenty of potential catalysts with Greece, the Fed considering raising rates and a slow down in China. But not much movement. Well that is not completely true. There have been winners and losers in the market. Financials have been moving higher and my famous burger portfolio has rolled over to name a few.

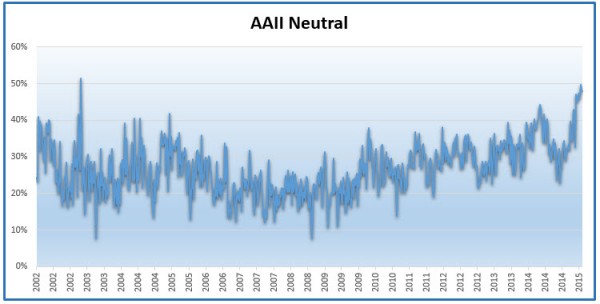
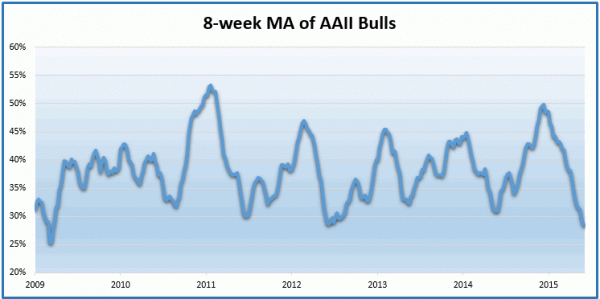
It has gotten so flat that perhaps investors did sell in May and go away this year. The latest AAII sentiment survey data shows that those who are neutral on the market is at 12 year high. But that number also means there is some fuel building for a move. The bullish sentiment below shows levels not seen since 2009. Do you now what the difference in the market is between 2009 and today? Let me remind you. 2009 had just seen a 13 year low print in the S&P 500 while last week made a new all-time high.

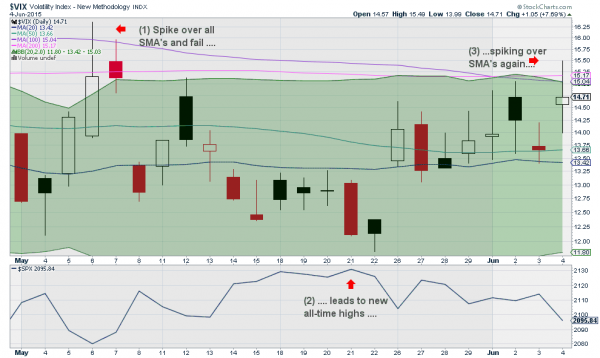
The combination leaves only about 25% left for the bears to claim. That is not a lot, and under its long term average as well. This series tells me that participants are comfortable with the market being in a range. This is not how sentiment read in February. Too many that alone would be a signal to look for a change. I did look Thursday, turning to the Volatility Index VIX. The chart below shows a pattern that has repeated 19 time since late 2012. When the VIX spikes up through its moving averages, then quickly settles back below them, it has lead to a new all-time high in the S&P 500 each time.
Thursday saw that spike over the SMA’s. If it continues and holds up there then we will have to start to look more closely for signs of a downside move. But a break lower Friday, which the calculation for the VIX is naturally set up for, through the SMA’s will keep the upside focus. Oh, and there is a potential catalyst Friday in the Non Farm Payroll report.

Either way tomorrow does not set up to be a destructive day to the bullish thesis. There is still a lot of room left on the downside to the bottom of the range at 2030. And potentially there is the possibility of a break out of the range to the upside. Watch, listen and remain flexible.
The information in this blog post represents my own opinions and does not contain a recommendation for any particular security or investment. I or my affiliates may hold positions or other interests in securities mentioned in the Blog, please see my Disclaimer page for my full disclaimer.
