Index Futures Net Changes and Settlements:

Foreign Markets, Fair Value and Volume:
*As of 7:00 a.m. CST
Today’s Economic Calendar:
Today’s economic calendar includes the 52-Week Bill Settlement, Jobless Claims 8:30 AM ET, Philadelphia Fed Business Outlook Survey 8:30 AM ET, Retail Sales 8:30 AM ET, Empire State Mfg Survey 8:30 AM ET, Productivity and Costs 8:30 AM ET, Industrial Production 9:15 AM ET, Business Inventories 10:00 AM ET, Housing Market Index 10:00 AM ET, EIA Natural Gas Report 10:30 AM ET, Treasury International Capital 4:00 PM ET, Fed Balance Sheet & Money Supply 4:30 PM ET.
S&P 500 Futures: S&P 500 Crash and Burn

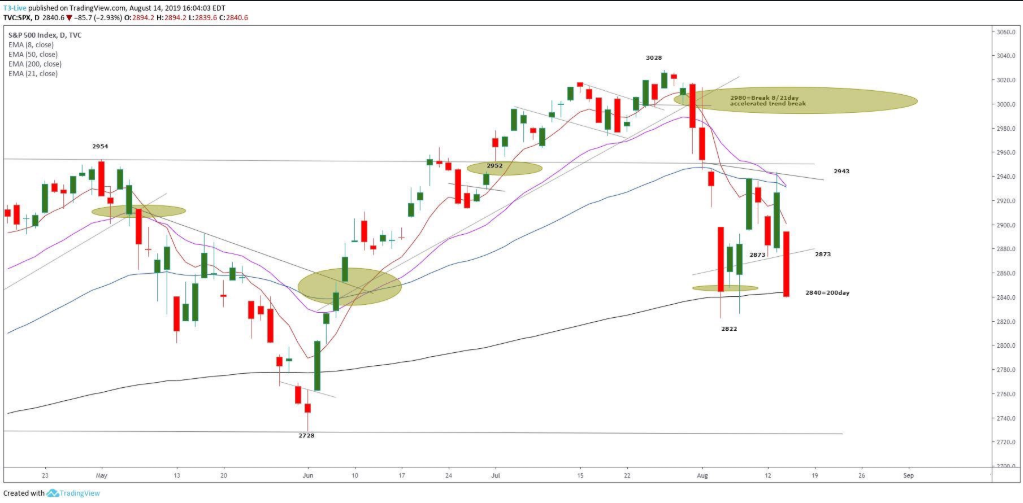
Chart courtesy of Scott Redler @RedDogT3 – $spx futures -7 as we see if we stay below 2839, or not! Below that is last weeks low of 2822. If this doesn’t hold then 2780. If 2839 gets reclaimed for a tactical bounce, there’s room to 2873 resistance area.
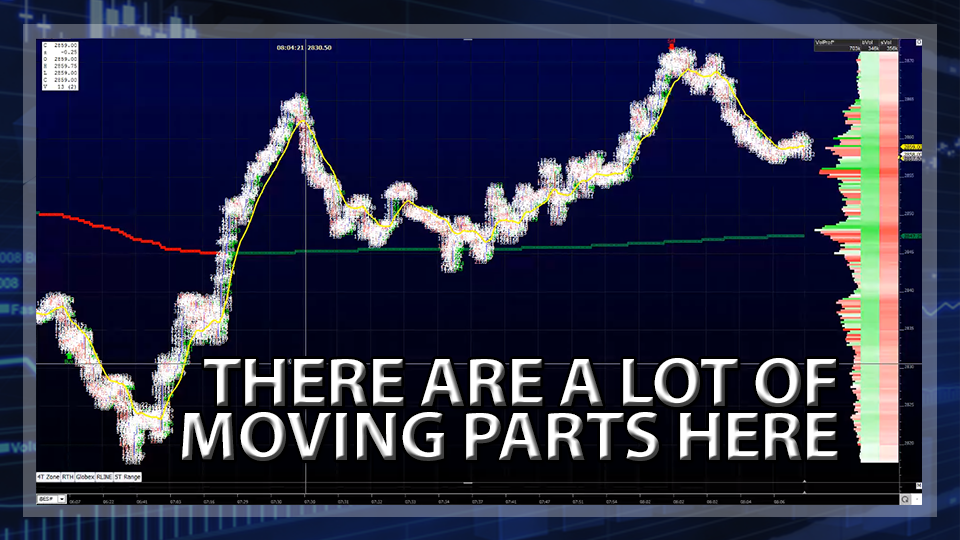
During Tuesday nights Globex session, the S&P 500 futures (ESU19:CME) printed a high of 2936.50, then spent the rest of the session selling off down to 2879.25, before opening Wednesday’s regular trading hours (RTH) at 2882.50.
Bonds called the shots yesterday. Global economic woes are starting to have a serious effect on U.S. interest rates, especially the negative rates in Europe, and stocks responded to the inverted yield curve by going into a tailspin.
It was a steady relentless grind lower, and it lasted all day. The RTH high was printed just after the 8:30 CT bell, and the RTH low was printed on the 3:15 close. That says it all right there.
Traders like volatility, but they don’t like it when it comes this fast. After the ESU closed up over 2% Tuesday, they turned around and fell 3% Wednesday. The VIX, which fell to 17.66 Tuesday, traded up to 24.10 yesterday, up 4.58%.
The big question is, is this the beginning of a trend change, or will it end up just another buying opportunity before new highs? It’s a hard question to answer, but I will say, I am not surprised by yesterday’s selloff.
