The following is an excerpt from this week’s edition of Notes From the Rabbit Hole, NFTRH 488. For NFTRH bonds are not just an asset class ‘throw-in’ but instead are a key indicator set to the entire modern macro. Insofar as it may be time to use them for portfolio balance (I am currently long SHV, SHY, IEI and IEF), so much the better. Many could not wait to buy bonds during US ZIRP global NIRP operations, but today they pay better interest and have a contrarian edge with the entire herd bracing for a bear market.
We claimed appropriately bearish on bonds on December 4, so you know this is not perma-book talking when we go the other way as yields hit our targets.
Bonds And Related Market Indicators
A subscriber asks for comment on sentiment in 1-3 year bonds and what it would take for me to “issue an all out buy signal” on them. He is a new subscriber and has not been through the agony and torment of my frequent disclaimers on the subject of how I am just a lowly participant who would not issue all out buys, sells or anything else for others. :-(
What I would do, however, is tell you what I am doing and last week to my recent buys in IEF (7-10yr) and IEI (3-7yr) I added SHY (1-3yr). The old saying goes “real men trade the long bond” and I guess I am not a real man because I don’t want to touch that far end (20+ years) of the curve at this time.
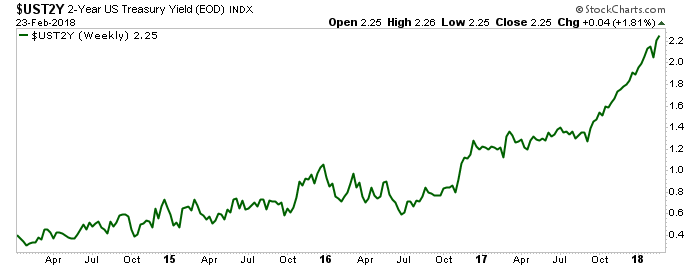
The reason I bought SHY is as it has been in the past, not to gain in its price but to use it as a dividend paying cash equivalent now spitting out significantly higher interest than it was just 6 months ago. Today, amid rising inflation concerns and everyone’s certain knowledge of a new bond bear market, it felt like the right time to increase bond exposure. The 2yr. is paying higher income and it turns over much more quickly than the 20+ year (NASDAQ:TLT).
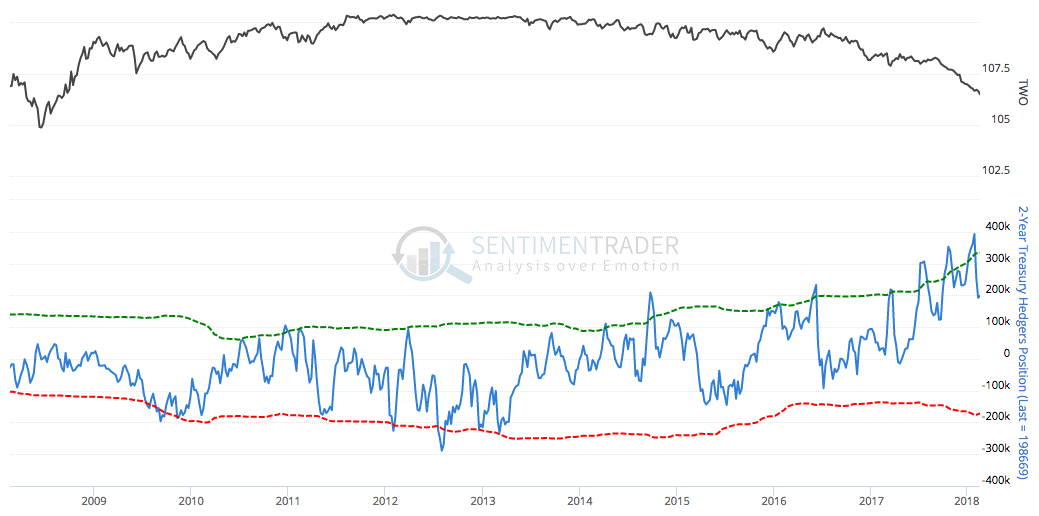
Here is the 2-Year note and its fairly favorable Commercial Hedgers position (public opinion is similarly constructive). This and similar graphics courtesy of Sentimentrader.
So if you buy 1-3yr. Treasury bonds you are buying something at a much cheaper price than a year or two ago and being rewarded with greater income each month. That’s all I can tell you other than for me, it was time to add this portfolio-balancer against the mass perception out there that bonds are done for.
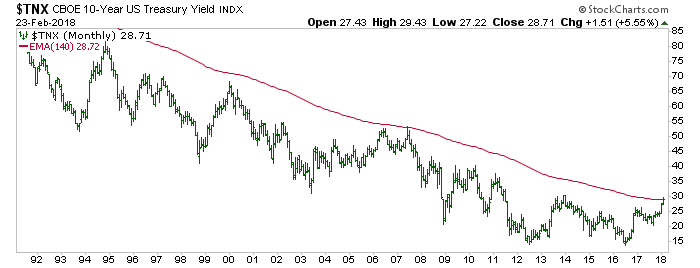
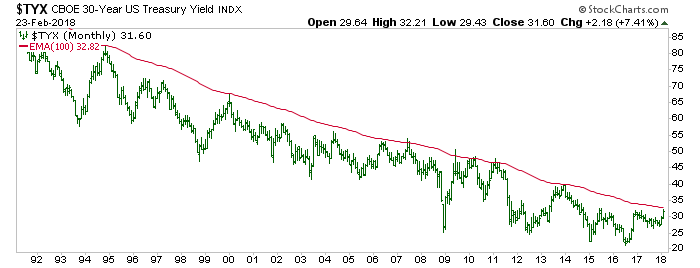
Again, they may well enter a bear market. There is certainly reason to believe that global debt is out of control, never to be reeled back in but rather, inflated away. But the 2yr is a borderline cash alternative and even on the longer dated Treasury bonds, a contrary setup is taking shape as we have been noting with Amigo #2 and his targets at the limiters.
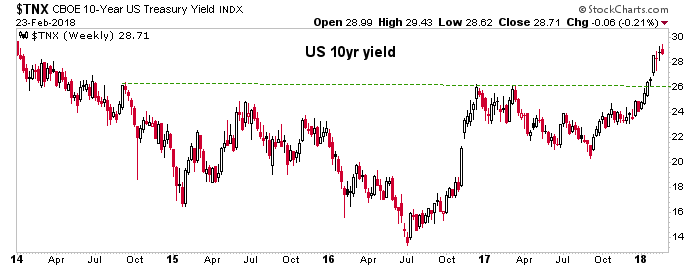
The 10-yr. is at the 2.9% target.
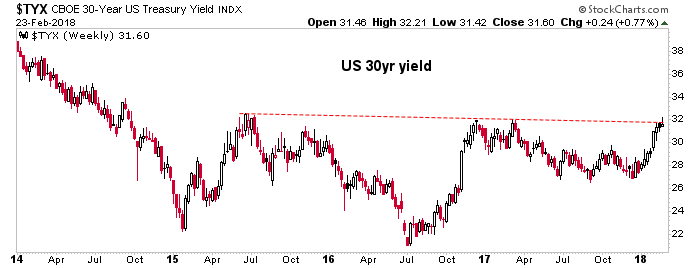
The 30-yr. got to 3.2%, a hair below the 3.3% target.
The thing here is that it was we who were watching for a rise in these yields and by extension, the inflation trade long before the masses got on the play. Now with the masses on board I take the other side of the trade at least for some portfolio balancing and income. Were I a perma bull on bonds you might suspect some book talking going on. But no, it’s just good old fashioned contrarian stuff with some income and portfolio balancing aspects to boot.
Here are the Commercial Hedger views on both the 10-yr. and 30-yr. They are contrary bullish and ‘getting there’, respectively with both showing net Commercial longs.
The weekly view of the 10-yr. yield is obviously bullish and that is why the herd is bullish. I don’t want to make fun of that because there have been times before when our bond market analysis, which would ultimately prove right, had to endure long periods before the favored view came in. So for now why don’t we just tout that the yield has reached target and be open to an eventual reversal. The thing about bonds though, is that you can position for portfolio balance and collect income while waiting to see if you’re right.
Interestingly, the 30-yr. weekly view has not yet broken out. Will it? The target is a bit higher, but it would be neat for it to halt at this point.
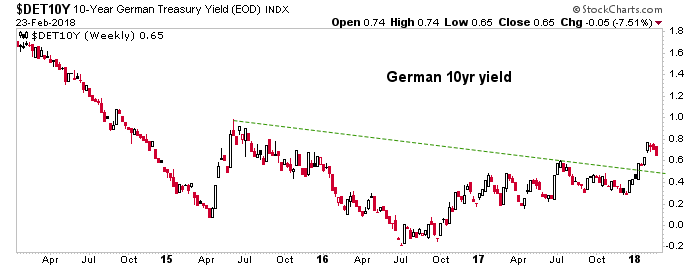
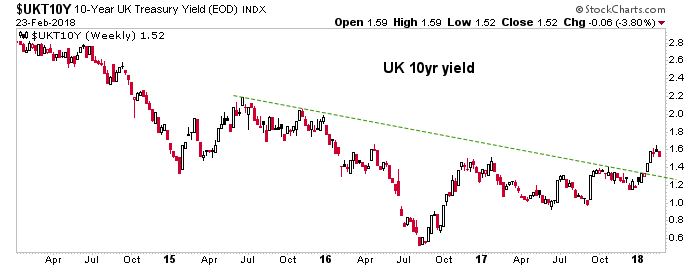
Global yields have already started to ease a bit, after all.
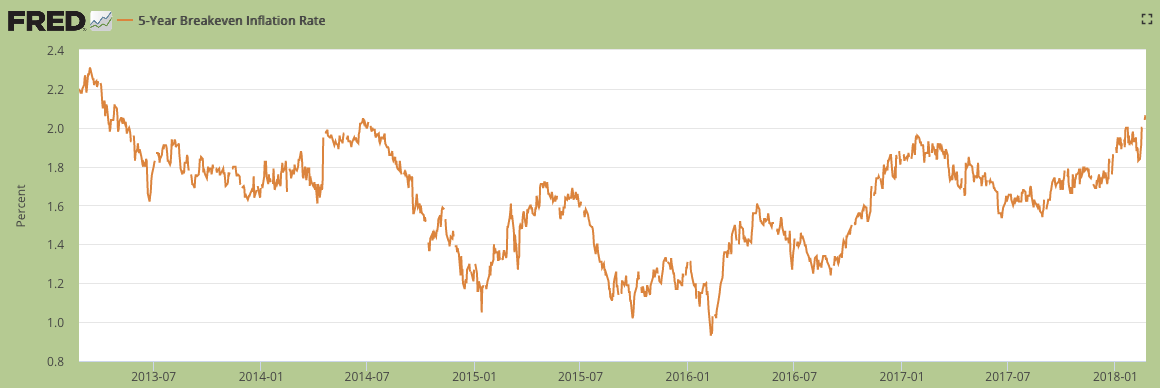
The Fed’s calculated 5-yr. and 10-yr. Breakeven Inflation Rates remain in the up trends that began in early 2016 when gold turned up first, led the miners and silver and then commodities and stocks. The gold sector has long since become an also-ran in the inflation sweepstakes, but the cyclical stuff has continued apace.
With respect to the message noted on page 17 yes [in the Global Market Internals segment, correlating inflationary price effects with world exports], I’d say that any waning of the current inflationary backdrop would not be good for global asset markets on balance.
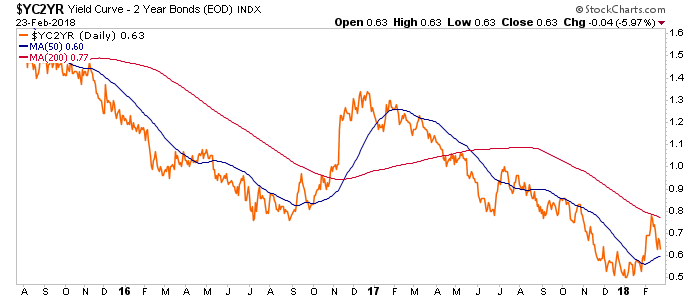
Let’s leave with a picture of the daily yield curve (macro Amigo #3), still down trending and favoring an ‘all’s well!’ view for the macro at this time.

