One of the key indicators we track in our bond strategy analysis is global sovereign bond market breadth. This simply captures the proportion of global government bond yields which are trending up/down (vs their 50 or 200 day moving average).
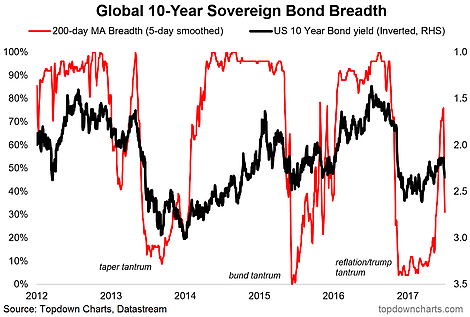
It's just like stock market breadth. Quickly check out the chart below and you can see how it works by noticing when the 3 major bond market tantrums of the past 5 years occurred. The reason I bring it up is because after bond breadth crashed in the "Trump Tantrum"—although I prefer to call it the global reflation tantrum because it was more about the global growth rebound—bond breadth is breaking down once again.
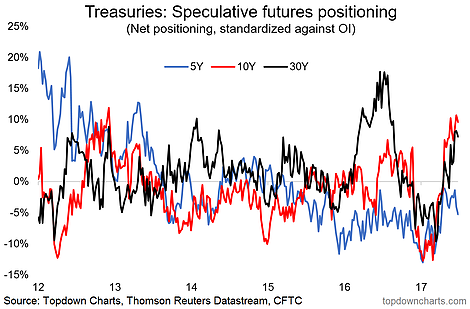
Notably, it comes after futures positioning had become extremely stretched to the long side, classic whipsaw conditions as the crowd rushed from one end of the spectrum to the other. Our view, and what we've been telling clients, is that bond yields were due for another run given the reset in breadth and positioning and the still constructive global growth outlook.
So the recent jump in yields—fueled partly by the taper talk from the ECB and BoJ—likely has further room to run. The line in the sand will be about the 2.6% mark for US 10-Year bond yields were the previous surge in yields topped out. Time and data will tell whether the line gets crossed, and if it does it will be game on for bond bears.
Bond market breadth had started to recover, and had pretty much undertaken a "reset" since the reflation/Trump tantrum, but is now breaking down again.

On speculative futures positioning (including for the 5-Year and 30-Year), we've seen the crowd run from one extreme to the other. The question is, how much can those crowded longs take before they capitulate.

