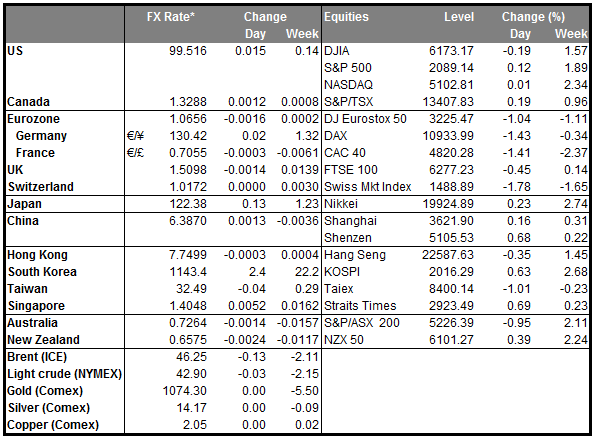
• BoJ joins the party with negative interest rates The BoJ adopted negative interest rates in a surprise move today, for the first time in its history. Bank officials decided to cut rates to -0.1% from +0.1%, by a 5-4 split vote. Markets were caught unprepared by the BoJ’s decision, as it came only a few days after Governor Kuroda explicitly stated that negative rates were not in board’s plans. Bank officials had previously described negative rates as an incentive for hoarding cash, but introduced them nevertheless in order to pre-empt the manifestation of downside inflation risks and to achieve the 2% target as soon as possible. Officials also expressed their commitment to cut rates further into negative territory if judged necessary. The move was motivated by an economy struggling with persistently low inflation, a stronger yen, the slowdown in China and perhaps the Bank’s intention to influence the spring wage negotiations in order to encourage upward inflationary pressures. Japan’s Nikkei 225 traded in a rollercoaster ride on speculation that the move was a sign of the BoJ running out of policy bullets. Anyhow, the index closed up 2.8%.The yen on the other hand plunged, as USD/JPY gained 2% following the decision and recovered all the losses we saw since the beginning of the year. Given that the Bank signalled the possibility for further policy action, we could see the recent selling pressure on the yen to continue in the near-term.
• Oil price rallies on production-cut hopes WTI futures rallied 1.5 dollars yesterday following reports that Saudi Arabia proposed OPEC and non-OPEC producers to agree to cut production by up to 5% in in an attempt to end the supply glut that has caused oil prices to plummet in recent months. The comments came from the Russian Energy Minister Novak, while a senior OPEC delegate said that Saudi Arabia is willing to cooperate. However, there have been no official comments from Saudi Arabia yet to confirm its willingness for such a deal. What is more, even if producers did manage to strike such an agreement, Iran may not be willing to join in. Following the removal of the sanctions, Iran has aggressively boosted its oil exports in an attempt to recover its lost market share and any compromise appears doubtful. Still, in the absence of any deal there is a notable possibility that oil prices could recover by the end of the year. Baker Hughes has recently forecast that the total number of active global rigs could decline by as much as 30% throughout the year as many minor producers are driven out of the market, which could end the supply glut on its own.
• Today’s highlights: During the European day, Eurozone’s preliminary CPI for December is expected to show an acceleration from the previous month. The German preliminary CPI for the same month accelerated on Thursday, which increases the possibilities for Eurozone’s figure to meet its forecast as well. Eurozone’s M3 money supply for December is coming out as well.
• In Norway, retail sales excluding automobiles are expected to have fallen in December, a turnaround from the previous month. The official unemployment rate for January is expected to have increased considerably. Given that both of the indicators are released at the same time, this could take off some of the recent strength in NOK.
• In the US, the main event will be the 1st estimate of Q4 GDP. Given the decline in exports and the falling oil investments due to the oil price collapse, the forecast is for a significant slowdown in Q4. The expected slowdown is supported by a variety of disappointing key economic indicators throughout the quarter such as the ISM manufacturing index, industrial production, durable goods and retail sales. What is more, in the statement from their last meeting, Fed officials acknowledged that economic growth slowed late last year. The quarterly PCE deflator is also coming out and the forecast is for the rate to have slowed. A possible slowdown in both indicators could encourage USD-bears to add to their positions. We also get the Chicago PMI and the final UoM consumer sentiment index, both for January.
• From Canada, we get the monthly GDP data for November. Even though the data are outdated, the indicator is expected to show an acceleration from the previous month. This could add fuel to the recent strength of the Loonie.
• We only have one speaker on Friday’s agenda: San Francisco Fed President John Williams.
The Market
EUR/USD continues higher
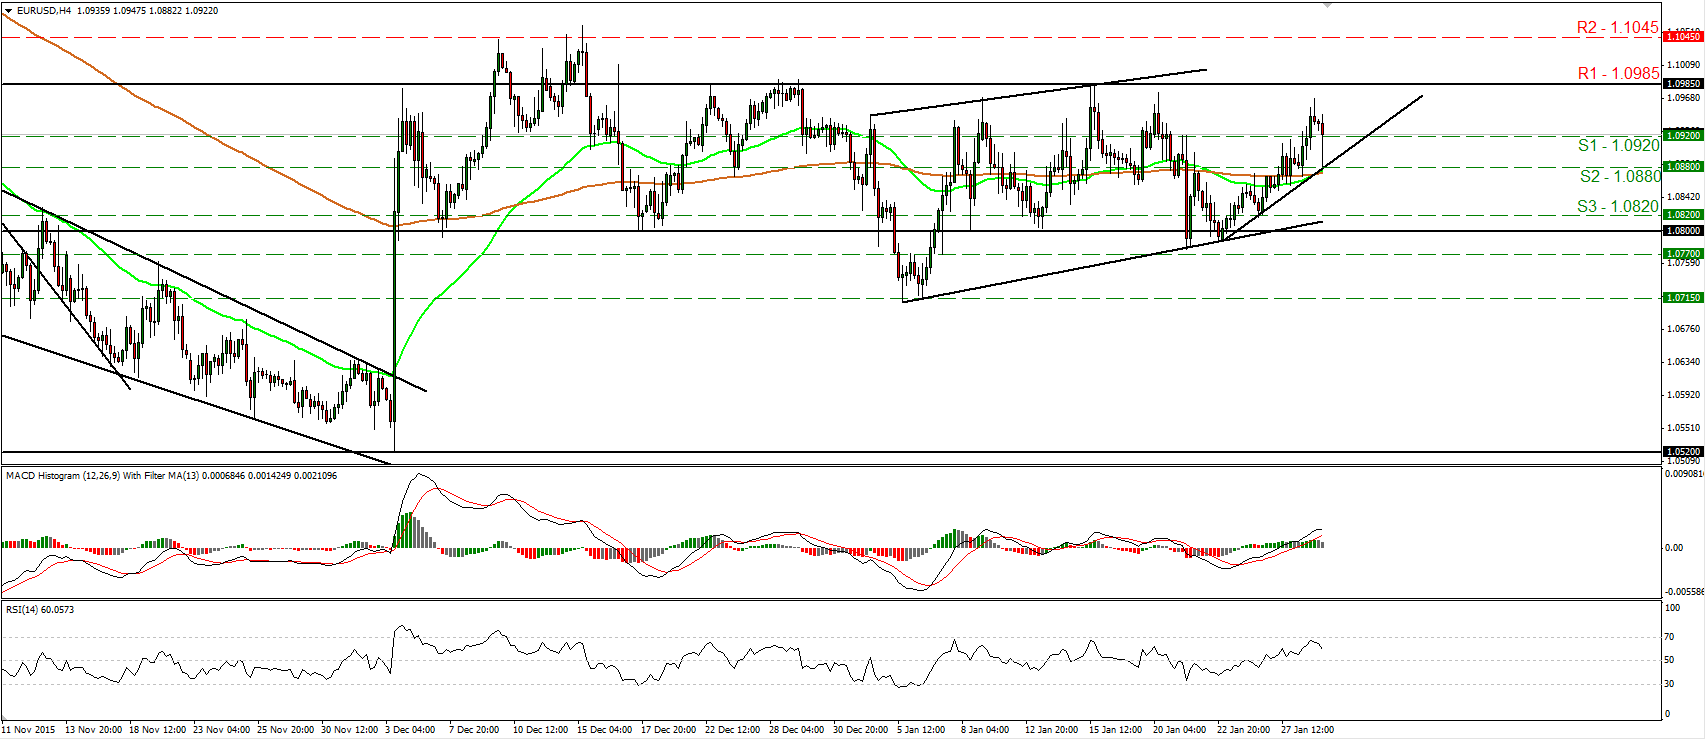
• EUR/USD continued trading higher yesterday breaking above the resistance (now turned into support) line of 1.0920 (S1). However, the rate failed to reach the 1.0985 (R1) key obstacle and retreated to hit support at the upside support line taken from the low of the 25th of January, near the 1.0880 (S2) level, before rebounding again. Although the rate remains above the aforementioned upside support line, I see signs that the rate may pull back again. A move back below the 1.0920 (S1) line is likely to aim for another test at 1.0880 (S2). This scenario is also supported by our short-term oscillators. The RSI found resistance fractionally below its 70 line and turned down, while the MACD, although positive, shows signs of topping and could move below its trigger line soon. Nonetheless, although there is the possibility for EUR/USD to slide a bit, as long as it is trading between the 1.0800 key support area and the resistance zone of 1.0985 (R1), I would still consider the near-term trend to be to the sideways. As for the bigger picture, I will hold the view that as long as the pair is trading above the support obstacle of 1.0800, the longer-term picture stays flat as well.
• Support: 1.0920 (S1), 1.0880 (S2), 1.0820 (S3)
• Resistance: 1.0985 (R1), 1.1045 (R2), 1.1045 (R3)
USD/JPY soars as the BoJ surprises the markets with negative rates
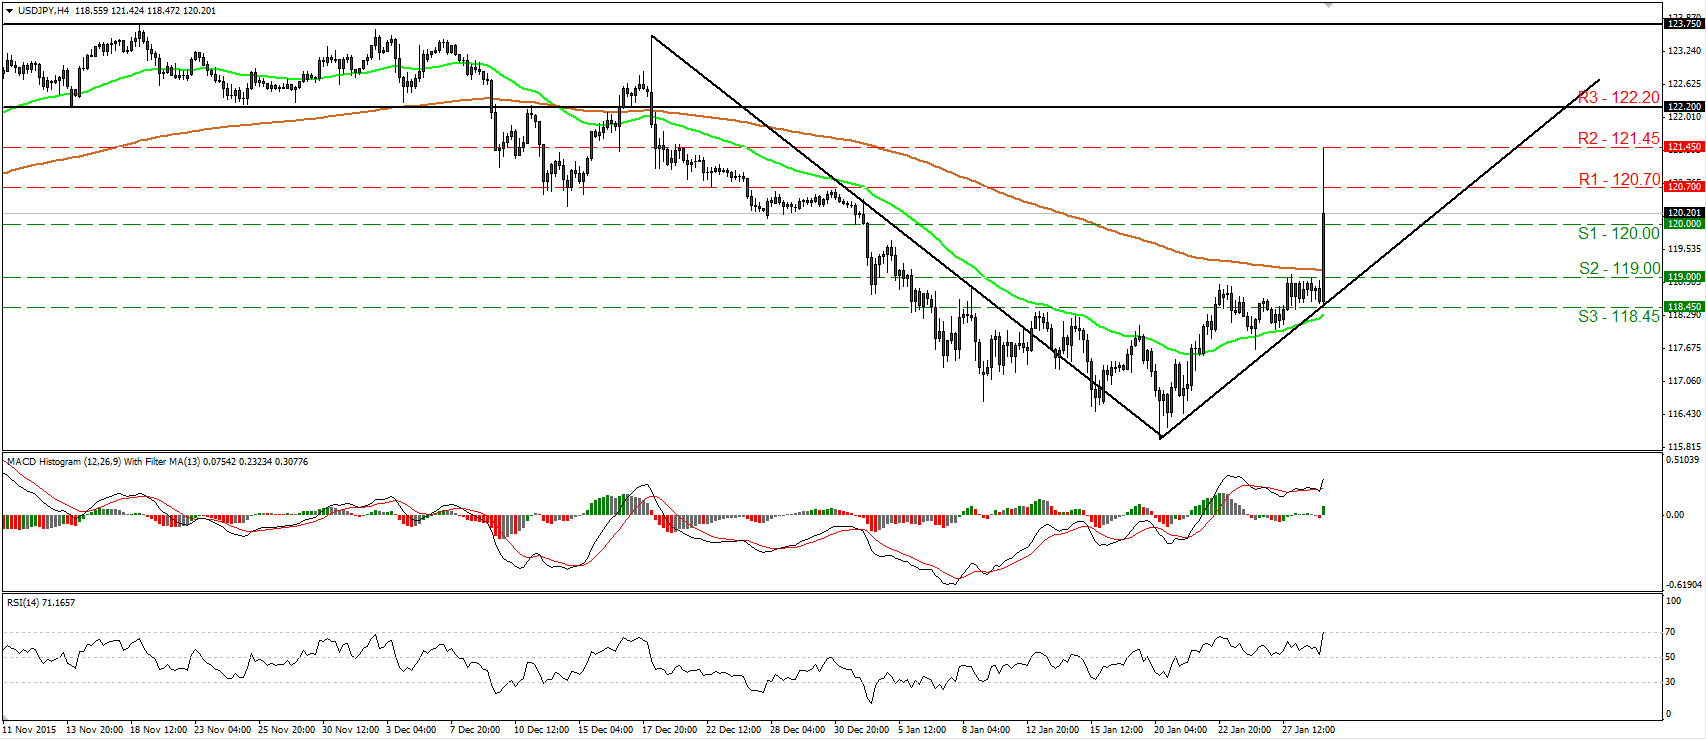
• USD/JPY surged during the Asian day Friday as the Bank of Japan decided to adopt negative interest rates on central banks deposits. The rally was stopped by the 121.45 (R2) line and then it retreated to calm slightly above the psychological zone of 120.00 (S1). Bearing in mind that the pair is now trading back above that round figure and that it also stands above the upside support line drawn from the low of the 20th of January, I would switch my view for the short-term outlook to positive for now. I believe that another attempt above the 120.70 (R1) line is possible to aim again for the 121.45 (R2) obstacle. Our short-term momentum studies detect strong upside speed and corroborate my view. The RSI climbed up and reached its 70 line, while the MACD, already positive, has emerged back above its signal line. As for the broader trend, given that the rate is now trading above the 120.00 (R1) psychological area, I prefer to hold a “wait and see” stance for now.
• Support: 120.00 (S1), 119.00 (S2), 118.45 (S3)
• Resistance: 120.70 (R1), 121.45 (R2), 122.20 (R3)
EUR/GBP slides after hitting resistance at 0.7665
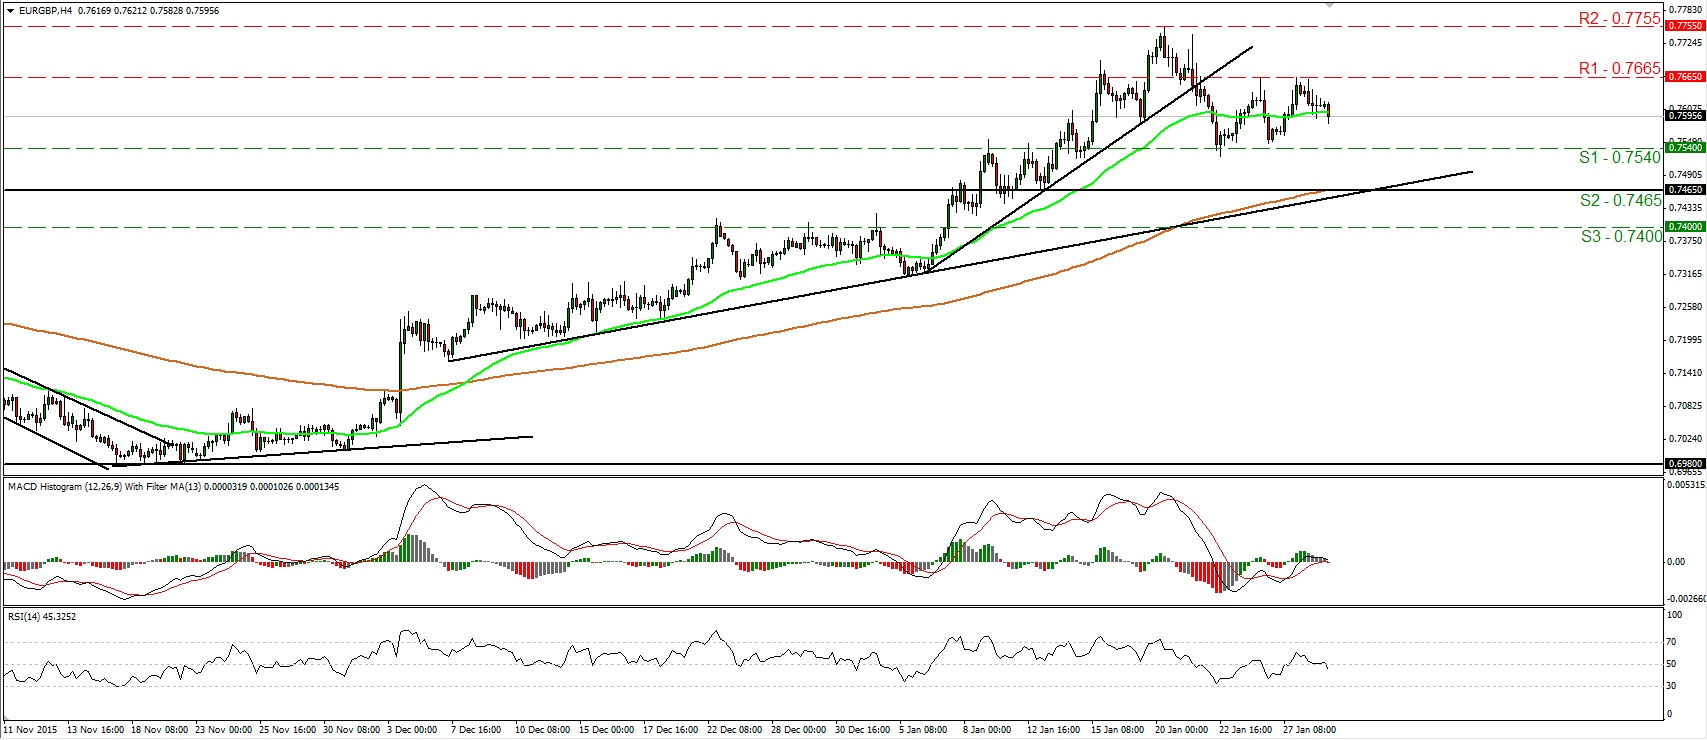
• EUR/GBP traded lower on Thursday after it hit resistance once again at the 0.7665 (R1) line. Given that the rate has been oscillating between that resistance and the support of 0.7540 (S1) since the 21st of January, I would consider the short-term outlook to be flat. For now I see the possibility for the pair to continue its retreat and perhaps challenge the lower bound of the aforementioned range. Our short-term oscillators support the notion as well. The RSI turned down and is now back below its 50 line, while the MACD has topped marginally above zero and now appears ready to turn negative again. Switching to the daily chart, I see that on the 8th of January, the rate managed to emerge above the upper bound of the sideways range the pair had been trading since the beginning of February 2015. This has turned the medium-term outlook positive and as a result, I would treat any possible near-term downside extensions as a corrective phase for now.
• Support: 0.7540 (S1), 0.7465 (S2), 0.7400 (S3)
• Resistance: 0.7665 (R1), 0.7755 (R2), 0.7865 (R3)
Gold retreats and hits support slightly below 1110
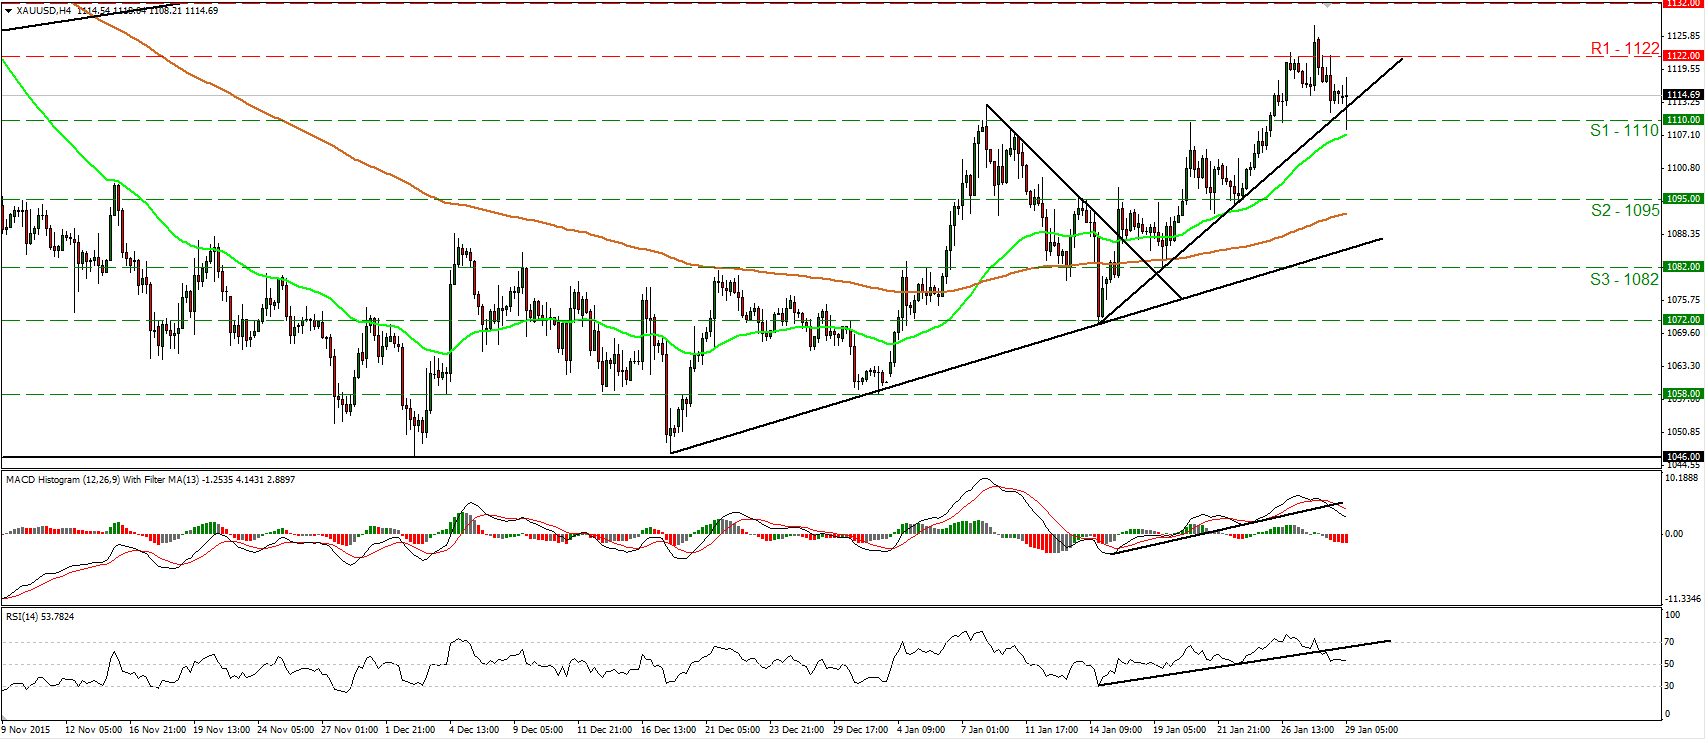
• Gold slid yesterday but the decline was stopped slightly below the 1110 (S1) support barrier and then the metal rebounded. The price structure remains higher peaks and higher troughs above the short-term uptrend line taken from the 14th of January and as a result, I would still consider the near-term outlook to be positive. If the bulls are strong enough to keep the price above the aforementioned uptrend line, I would expect them to aim for another test near the 1122 (R1) barrier. I believe that another attempt above 1122 (R1) is likely to carry more bullish extensions and perhaps target our next hurdle of 1132 (R2). Taking a look at our short-term oscillators though, I see that both of them fell below their respective upside support lines. What is more, the RSI edged down and hit support near its 50 line, while the MACD has topped and fallen below its trigger line. These signs raise concerns that yesterday’s retreat could continue a bit more. As for the broader trend, the break above 1110 (S1) on the 26th of January has confirmed a forthcoming higher high on the daily chart, something that keeps the medium-term outlook somewhat positive.
• Support: 1110 (S1), 1095 (S2), 1082 (S3)
• Resistance: 1122 (R1), 1132 (R2), 1140 (R3)
WTI rallies on hopes for production cut
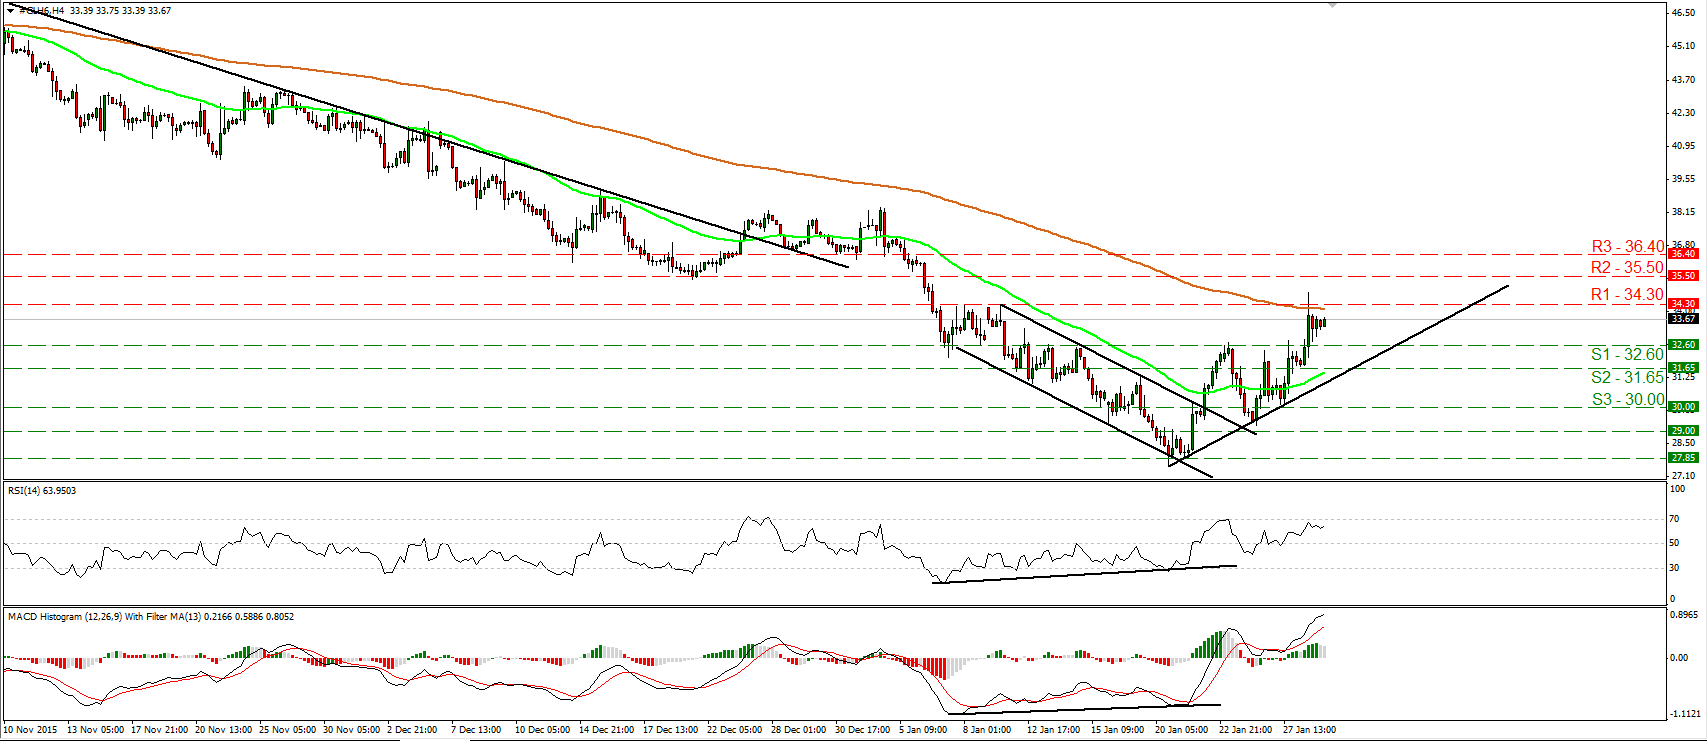
• WTI edged higher yesterday after the Russian Energy Minister said that Saudi Arabia has proposed oil-producing countries to cut their production by up to 5%. The news caused the price to emerge above the key resistance (now turned into support) barrier of 32.60 (S1) and to find resistance slightly above the 34.30 (R1) line. On the 4-hour chart, since WTI is trading above the uptrend line taken from the low of the 20th of January, I would consider the short-term picture to stay positive. A decisive move above 34.30 (R1) is possible to initially aim for our next resistance of 35.50 (R2). Looking at our short-term oscillators, I see that the RSI moved higher and hit resistance marginally below its 70 line, while the MACD stands above both its zero and trigger lines, pointing up. These indicators detect upside momentum and amplify the case for WTI to continue higher for a while. On the daily chart, I see that WTI has been printing lower peaks and lower troughs since the 9th off October. As a result, I would consider the longer-term picture to stay negative, and I would treat the recent recovery, or any possible extensions of it, as corrective move at the moment.
• Support: 32.60 (S1), 31.65 (S2), 30.00 (S3)
• Resistance: 34.30 (R1), 35.50 (R2), 36.40 (R3)


