✂ Fed’s first rate cut since 2020: Use our free Stock Screener to find new opportunities fastExplore for FREE

Bob Hoye Interview: The Technical Excess Of The DJIA

Published 08/11/2017, 02:07 AM
Updated 07/09/2023, 06:31 AM
DJI
-
DX
-

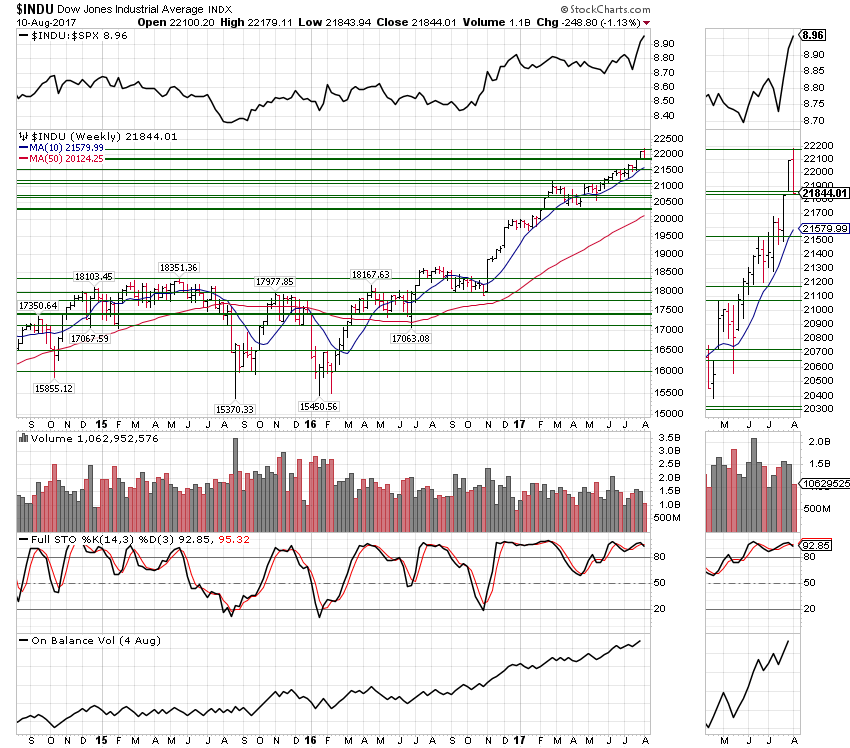
INDU Weekly Chart

Technical Excess DJIA

As widely reported, the latest run in the venerable Dow was exceptional. By our measures, the strongest since the summer of 2007 when the action registered an Upside Exhaustion, which is momentum. Also registered was a Sequential (9) Sell, which is pattern.

The Dow rally was essentially driven by dollar weakness. What happens when the DX goes up?

In that fateful year, 2007, the September target was eclipsed with the peak being set on October 11.

This time around, the Dow has also accomplished an Upside Exhaustion and the Sequential (9) Sell.

A seasonal chart updated for the period 1983 to 2010, indicates the key high occurring in late August. The next low would be in late October.

We have been looking for a “thrust” into September. The recent “surge” will do, very nicely. On our target for the high, it can be centered in September, with the actual high possible in late August or early October.

Conditions for the completion of this bull market are as clear as they were in August 2007. That’s just using the action in the stock market. The conclusion is supported by developments in credit markets, the dollar and industrial commodities.

Latest comments

Loading next article…
Risk Disclosure: Trading in financial instruments and/or cryptocurrencies involves high risks including the risk of losing some, or all, of your investment amount, and may not be suitable for all investors. Prices of cryptocurrencies are extremely volatile and may be affected by external factors such as financial, regulatory or political events. Trading on margin increases the financial risks.
Before deciding to trade in financial instrument or cryptocurrencies you should be fully informed of the risks and costs associated with trading the financial markets, carefully consider your investment objectives, level of experience, and risk appetite, and seek professional advice where needed.
Fusion Media would like to remind you that the data contained in this website is not necessarily real-time nor accurate. The data and prices on the website are not necessarily provided by any market or exchange, but may be provided by market makers, and so prices may not be accurate and may differ from the actual price at any given market, meaning prices are indicative and not appropriate for trading purposes. Fusion Media and any provider of the data contained in this website will not accept liability for any loss or damage as a result of your trading, or your reliance on the information contained within this website.
It is prohibited to use, store, reproduce, display, modify, transmit or distribute the data contained in this website without the explicit prior written permission of Fusion Media and/or the data provider. All intellectual property rights are reserved by the providers and/or the exchange providing the data contained in this website.
Fusion Media may be compensated by the advertisers that appear on the website, based on your interaction with the advertisements or advertisers.
© 2007-2024 - Fusion Media Limited. All Rights Reserved.