- The inclusion of Blackstone in the S&P 500 index is a positive development for the company
- The company has been paying dividends regularly for 17 years
- The fact that the stock is trading at a discount to its fair value estimate suggests that it may be undervalued
Following its inclusion in the S&P 500 index, Blackstone Group (NYSE:BX) experienced a notable 4% surge. This momentum has not waned, as the stock has continued to climb, shifting from its previous range around $104 to a robust $108.
The market's response has been marked by optimism, driven by factors poised to broaden the company's investor base. Among these, heightened demand from institutional investors, stemming from its S&P 500 inclusion and presence in ETFs, stands out.
Blackstone, a significant player in the investment services sector boasting a market capitalization of $76.8 billion, operates across four key segments: real estate, private equity, credit and insurance, and hedge funds. This diversified business model strategically positions the company as a formidable force within the financial sector.
The stock price is higher than many of its peers and is currently trading around the $110 mark, hovering near the 52-week highs. This turnaround comes after Blackstone entered a long-term downtrend from its historical peak near $150.
This decline began as speculation emerged about the Federal Reserve's intention to start raising interest rates in November 2021.
In response, BX experienced a downward trend, hitting a low of $71 in December of the previous year. However, it reversed this trend in 2023, stabilizing after a correction in the first quarter and breaking the pattern of lower peaks.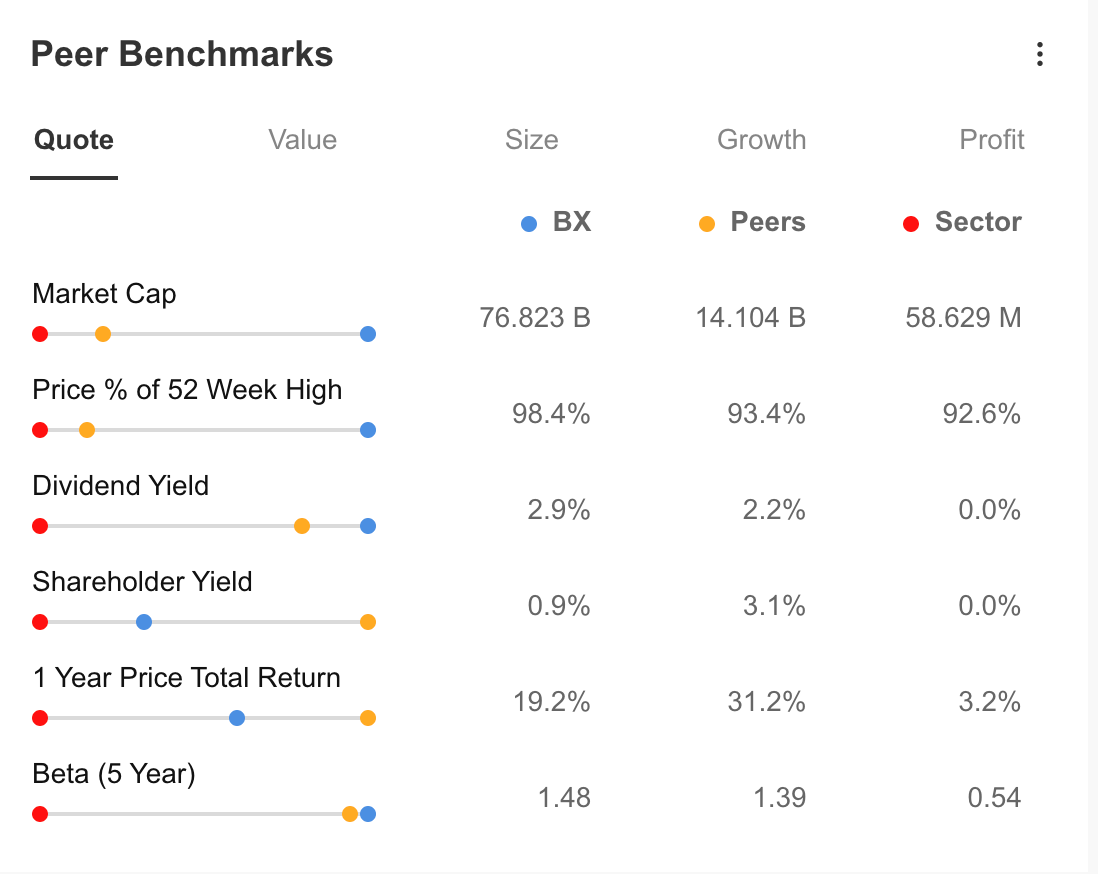
Source: InvestingPro
When comparing Blackstone to its peers, you'll notice that it maintains an attractive dividend yield, currently at 2.9%. This yield remains higher than what you'd find with similar companies, making it appealing to long-term investors, even during a downward trend.
However, the shareholder yield, at 0.9% and 3.1%, is relatively low compared to its peers. This means that while the one-year return on Blackstone's shares is approaching 20% due to its recovery, it still falls behind the 31% return of its peer group.
It's worth noting that the company's 5-year beta is close to 1.5, indicating that it can react swiftly to broader market recoveries.
This suggests that Blackstone has the potential to expedite its recovery process, especially given the recent uptrend in the stock markets.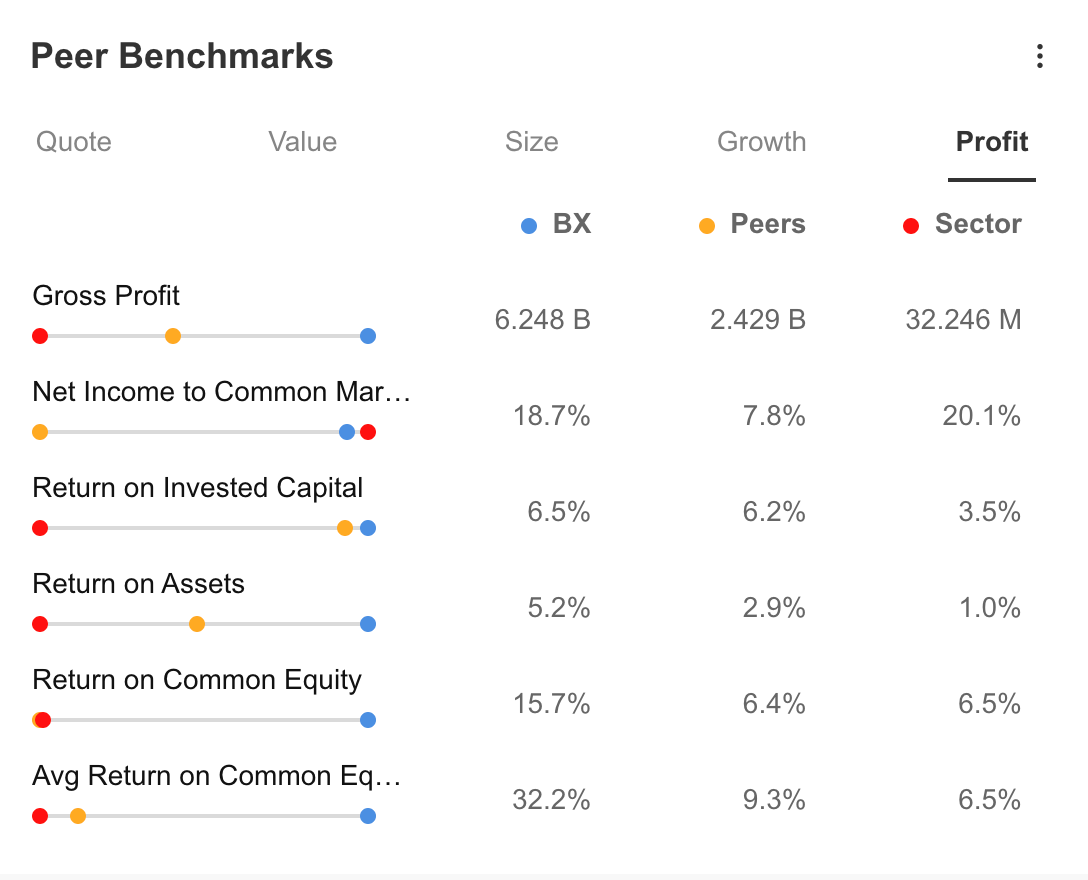 Source: InvestingPro
Looking at the company's profitability, Blackstone's gross profit of $6.2 billion stands as a positive factor above the average of peer companies, which is $2.4 billion, according to a comparison made on InvestingPro.
In addition, the ratio of net profit to share margin, return on assets, and return on equity are among other positives.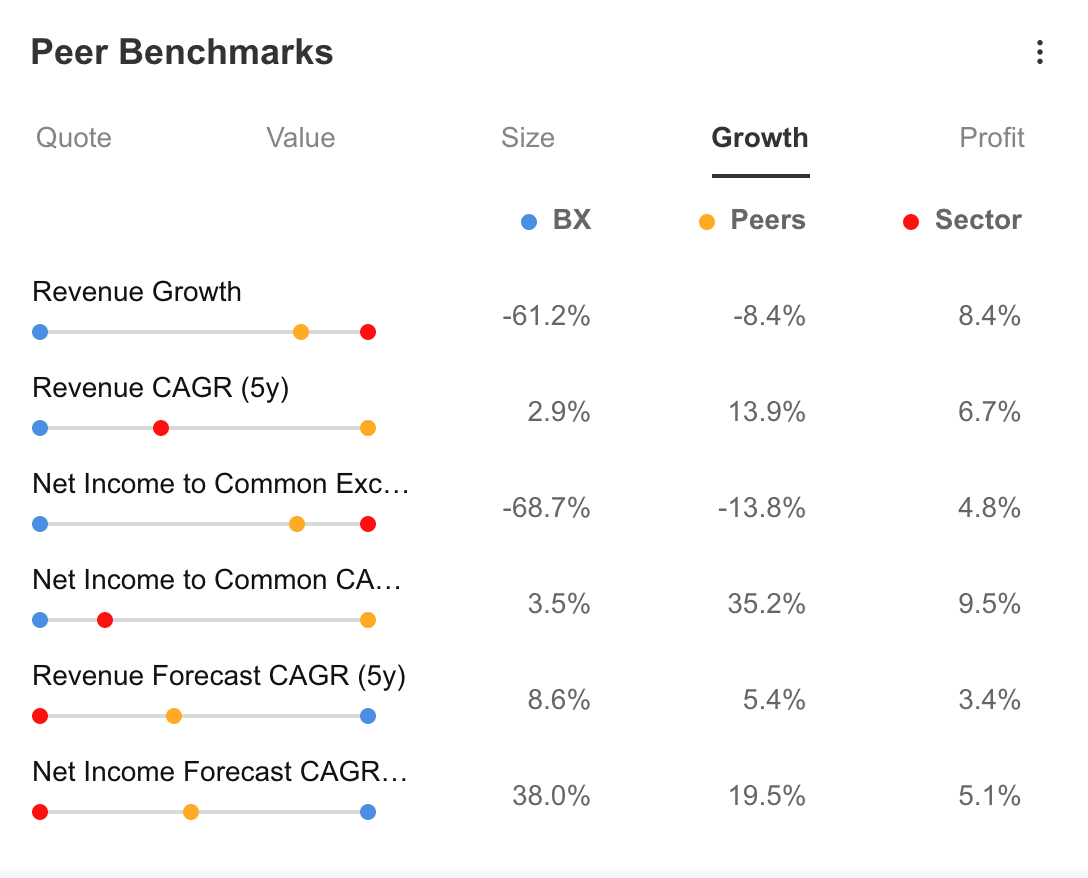 Source: InvestingPro
The company's growth situation stands as an aspect that should be closely monitored.
Although profitability continues at good rates, the 61% decline in revenue growth is relatively high compared to the positive trend of the sector and peers that have seen a partial decline in revenue growth.
This indicates a downward trend in profit per share. On the other hand, the 5-year revenue and net profit forecast reflects positive expectations for the company in the coming years.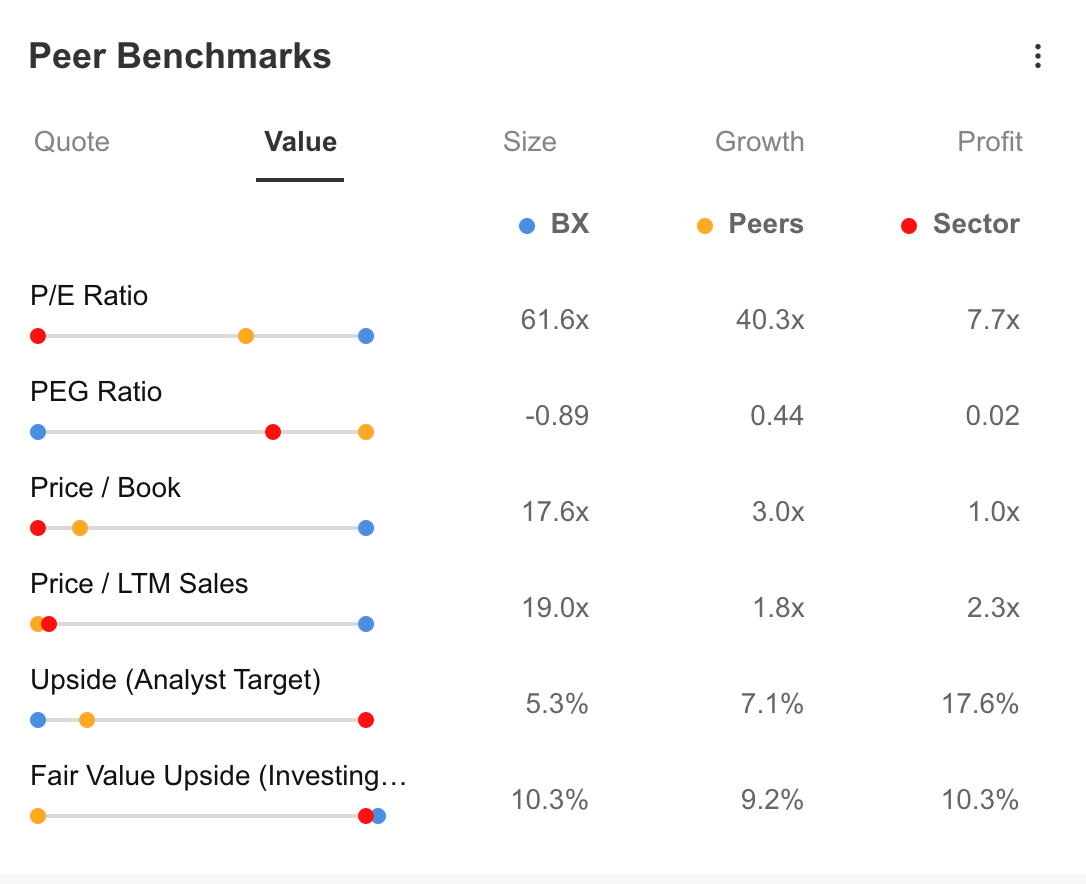
Source: InvestingPro
While there are forecasts for the company's growth potential for the coming years, BX's P/E ratio remains high at 61x. This indicates that demand remains alive despite the share trading at a premium.
The PEG ratio indicates that the share value is undervalued based on the company's growth expectations.
On the other hand, price/sales and price/book value ratios show that the stock is moving at a slightly higher premium compared to its peers, with 17x and 19x values, respectively.
Source: InvestingPro
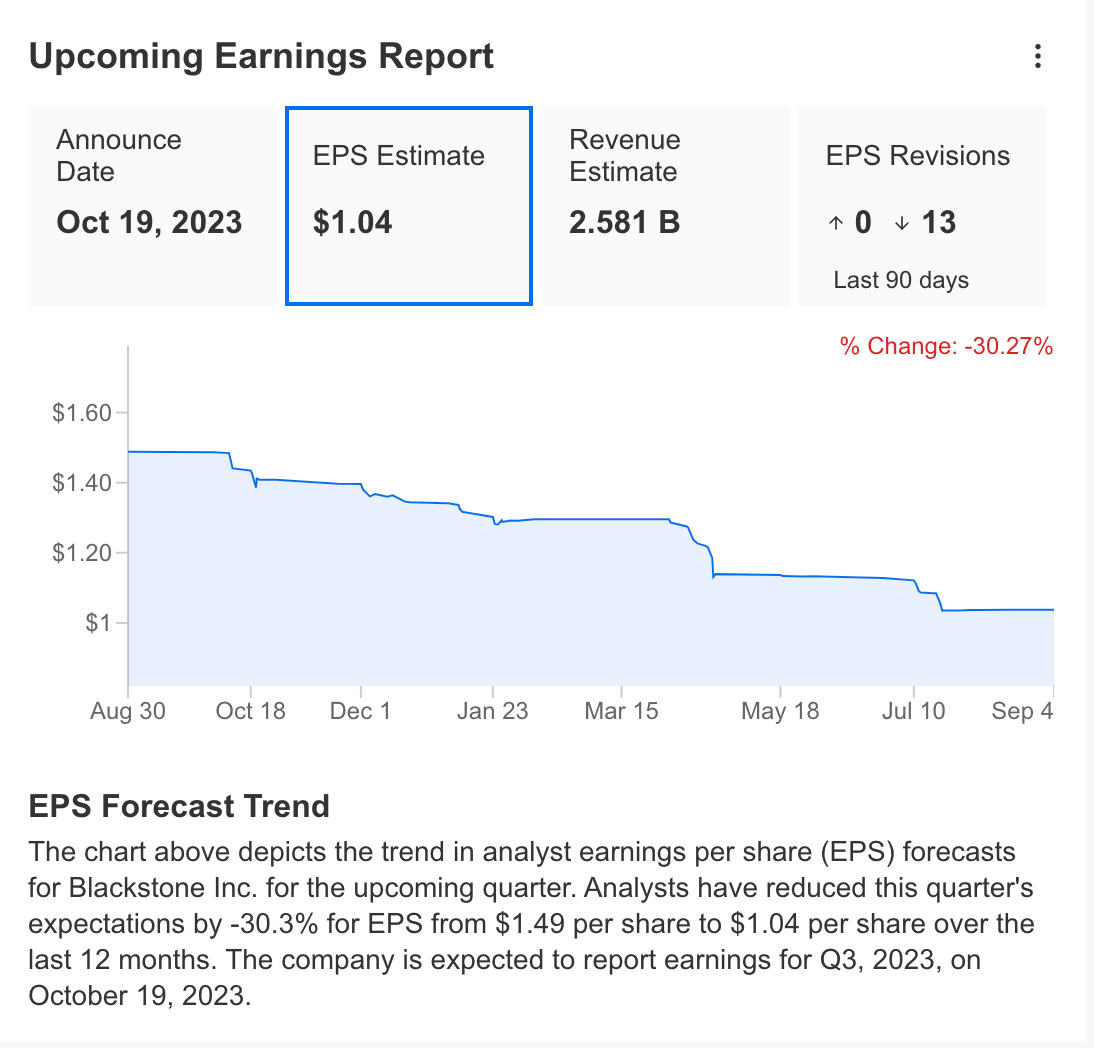
In its last earnings report published on June 30, Blackstone announced its earnings per share as $0.93, slightly above expectations.
Revenue came in at $2.35 billion, 2.2% below InvestingPro expectations. For the next earnings, expected to be released on October 19, analysts revised their expectations for the current period downwards, expecting a profit per share of $1.09.
Revenue expectation for Q3 is 2.58 billion dollars.
InvestingPro platform projects a decline in earnings per share this year but healthy profitability in the medium and long term.
The revenue forecast is estimated at $10.8 billion, down 10% this year, reflecting the problems in growth. However, significant revenue growth is expected to support the company's profitability in the coming year. 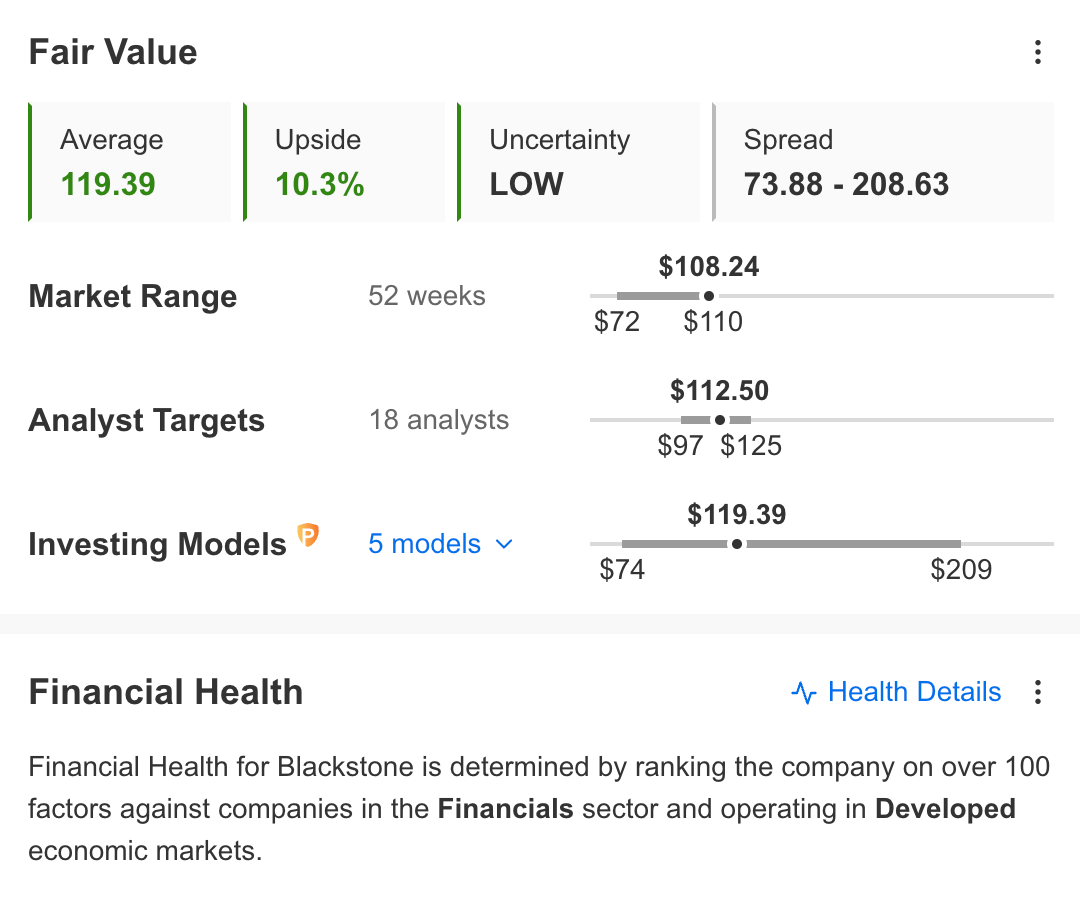
Source: InvestingPro
In light of this information, the InvestingPro platform's five financial models currently calculate the fair value of BX as $119.
Accordingly, it can be said that the stock is trading at a discount of 10%. The forecast of 18 analysts for this year is slightly lower, at an average of $ 114.
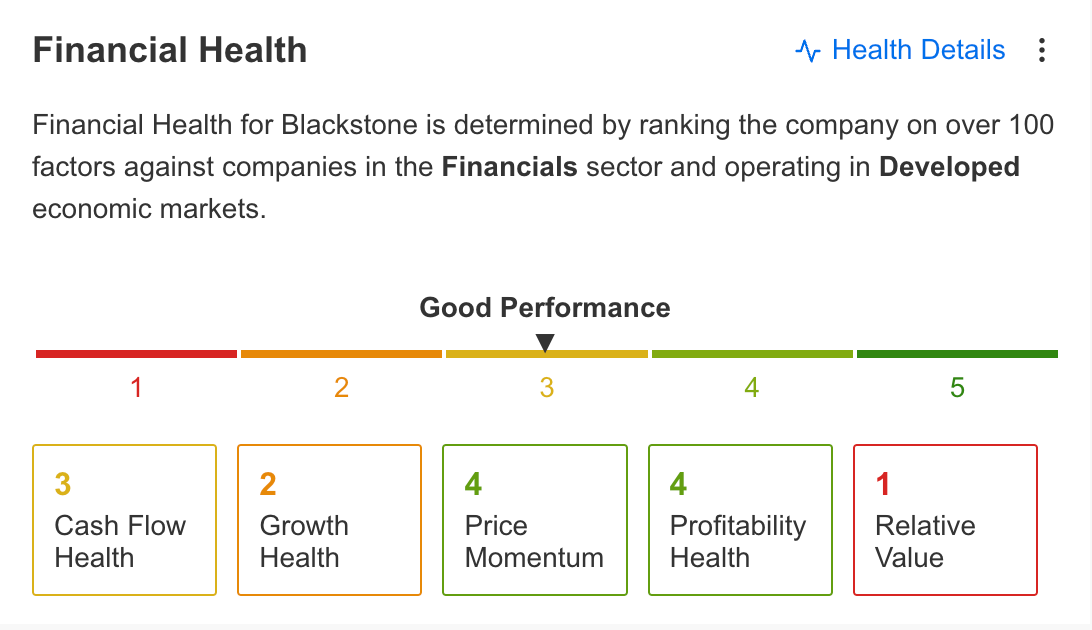
Finally, we can take a quick look at the company's general health status and its positive and negative aspects through InvestingPro.
Positive aspects:
- The company has been paying dividends regularly for 17 years
- Net profit growth expectation for this year
- Returns higher than book value
- Remaining profitable in the last year
- Strong performance in the last three months
- High returns over the last ten years
Negative aspects:
- The downtrend in earnings per share
- High Price/Earnings ratio
Source: InvestingPro
The company's financial performance is good based on profitability, growth, cash flow, share price momentum, and relative value. Profitability and price momentum are strong, while growth and relative value weaken financial performance.
Blackstone: Technical Analysis
If we analyze the BX share from a technical standpoint, the first thing that stands out is the trend reversal after the breakout in June on the weekly chart. 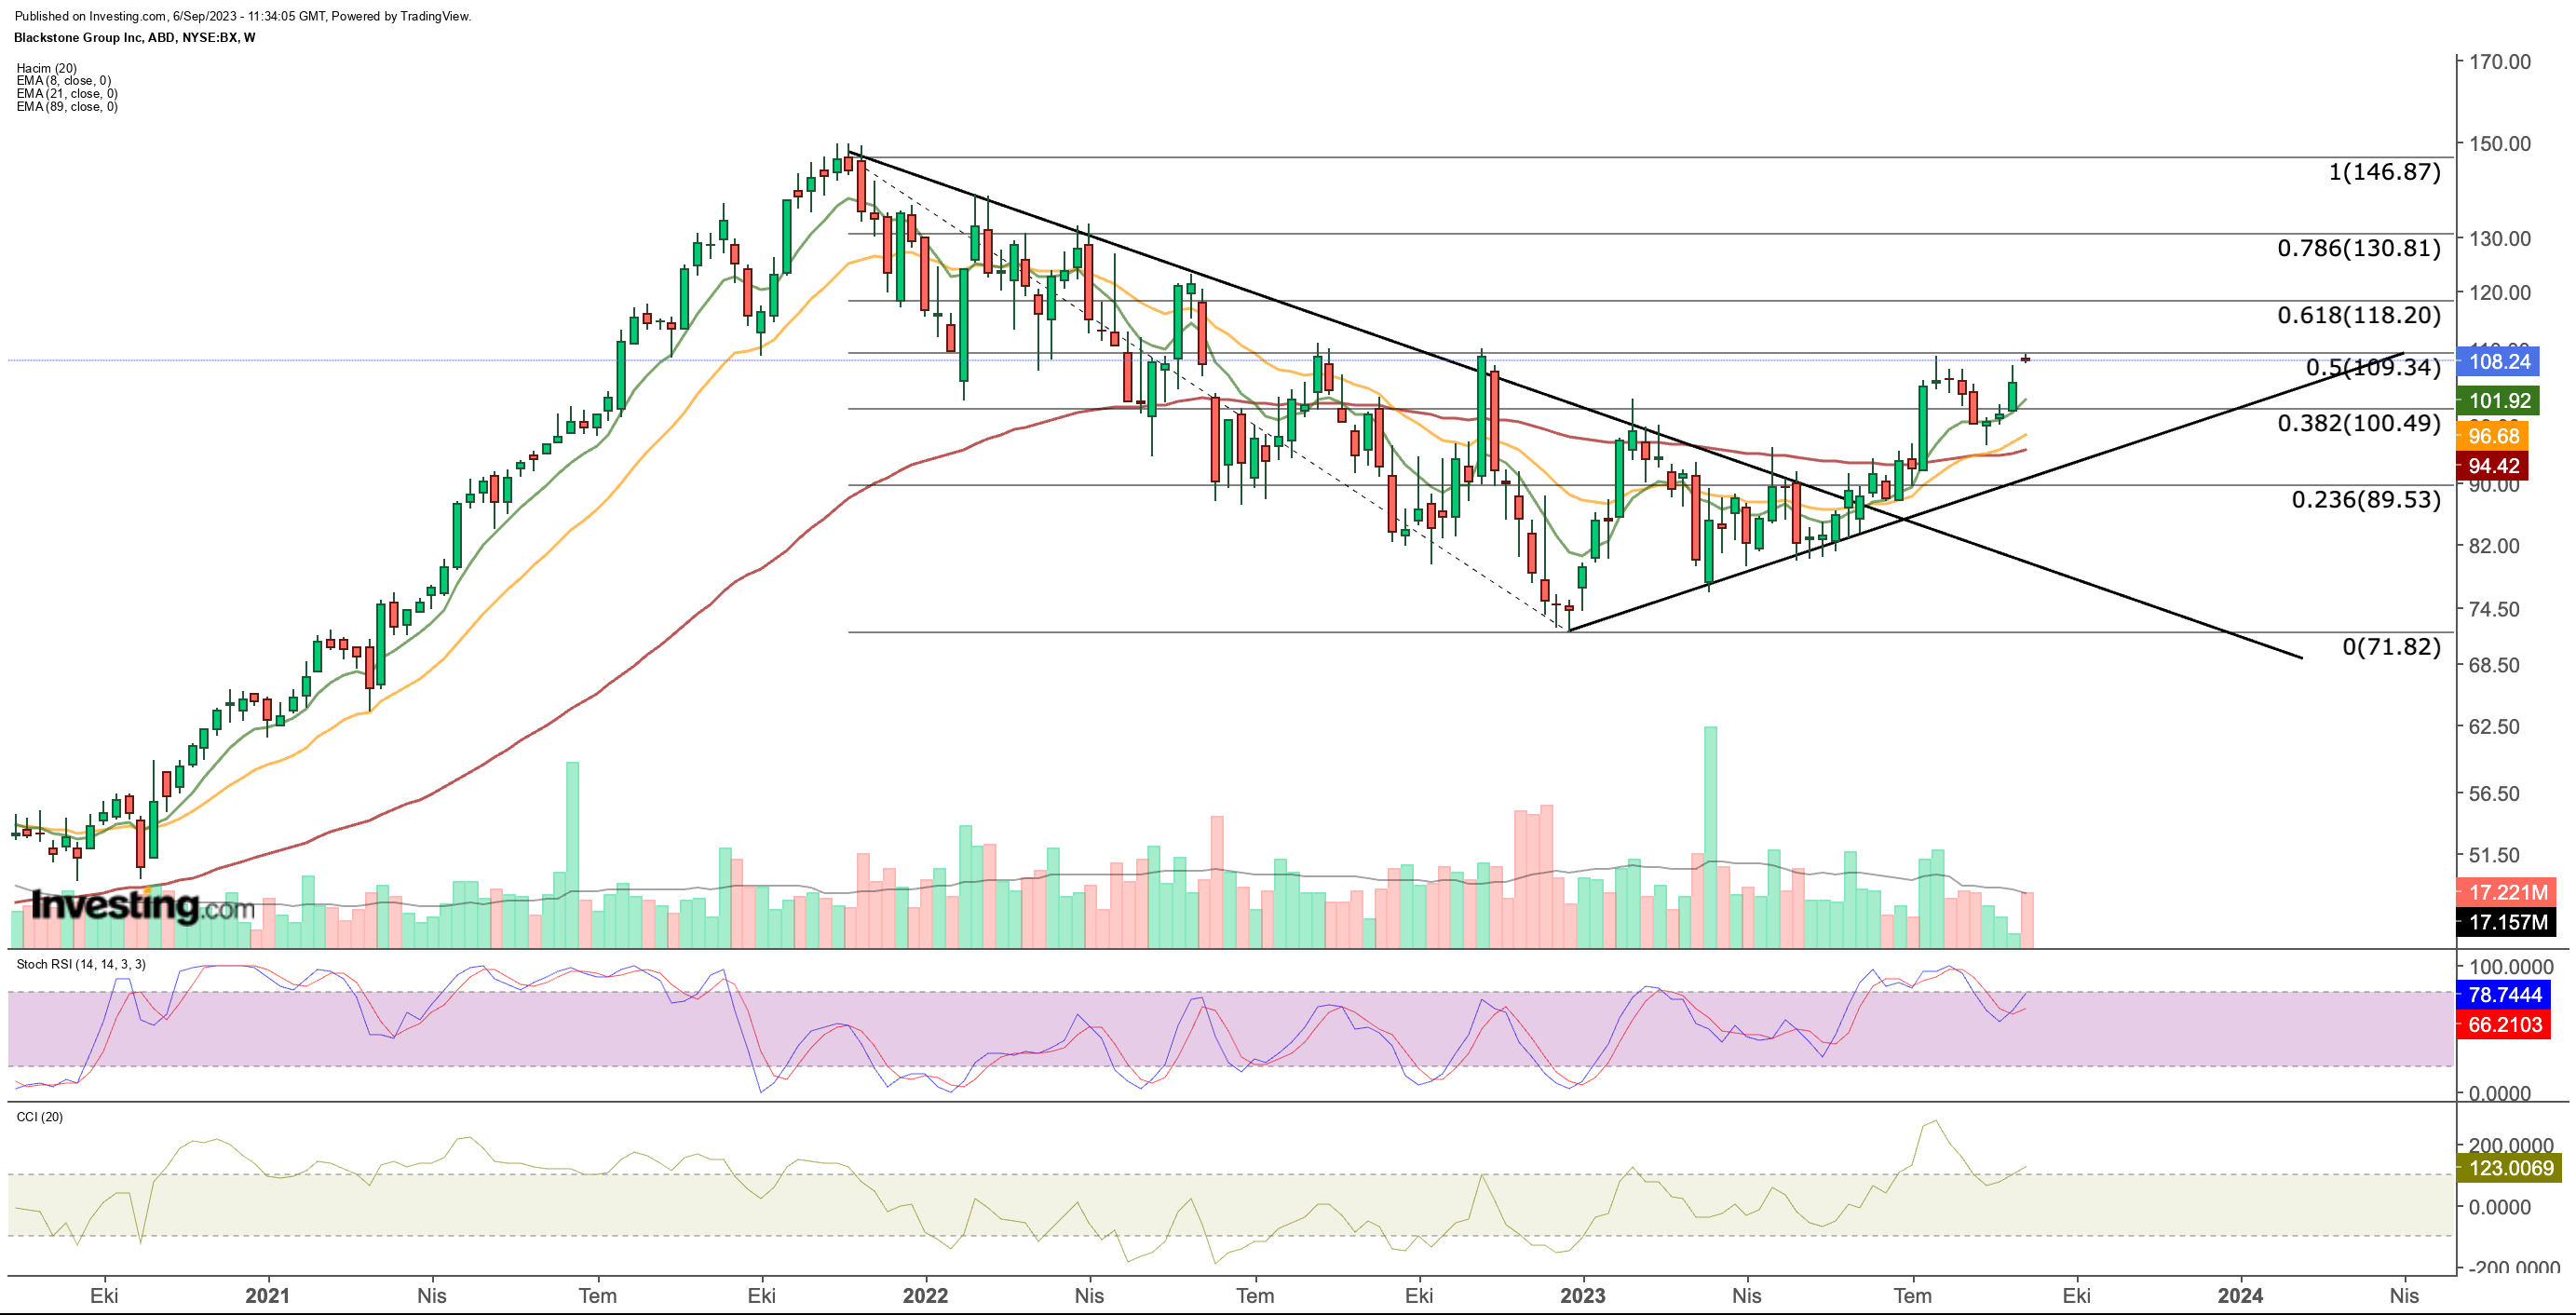
After breaking out, the share price surged past the $100 level, breaking the pattern of lower highs and lower lows. However, since July, it has encountered resistance in its attempt to surpass last year's highs around $110.
A weekly closing above $110 could act as the catalyst for an uptrend, potentially propelling BX towards $118 (Fib 0.618) in the coming months, with the possibility of reaching $130 (Fib 0.786) contingent on price momentum.
Conversely, in the lower range, $100 serves as a crucial support level. If a breakout occurs below this point, it might trigger a correction toward $95, coinciding with the short-term ascending trendline.
In summary, as long as BX maintains its position above $100, there's potential for continued upward momentum.
***
Disclosure: The author holds no position in any of the instruments mentioned in this report.

