Bitcoin bulls are in retreat, at last. After the cryptocurrency’s meteoric surge to $42 000 at the start of 2021, the price dipped below $29 000 earlier today. And since BTC is one of the most-widely followed assets these days, experts were quick to offer their views. JP Morgan analysts stated that $40k is a “key battleground” the bulls must retake for the uptrend to continue. A report by Bloomberg said virtually the same thing.
Well, we would’ve been very impressed had JPM and Bloomberg identified $40k as a key level, when BTC/USD was at $20k or $30k. But what is the point in stating the obvious when the resistance around $40k is already there for everyone to see? You don’t have to be an expert for that.
We, at EWM Interactive, also didn’t know that the top was going to form at $42k. As the price was surging by thousands of dollars every day, how high it could go was anyone’s guess. What we did know, however, was that no trend lasts forever and Bitcoin’s was unlikely to, as well.
So, as BTC/USD kept rising, we urged subscribers not to chase it. Fortunately, even if a precise prediction is not always possible, traders can always be prepared, provided they adopt the correct mindset. The next charts show how the Elliott Wave principle helped us prepare for the reversal. Also, how it was possible to take advantage of the situation once the market’s intentions became clearer.

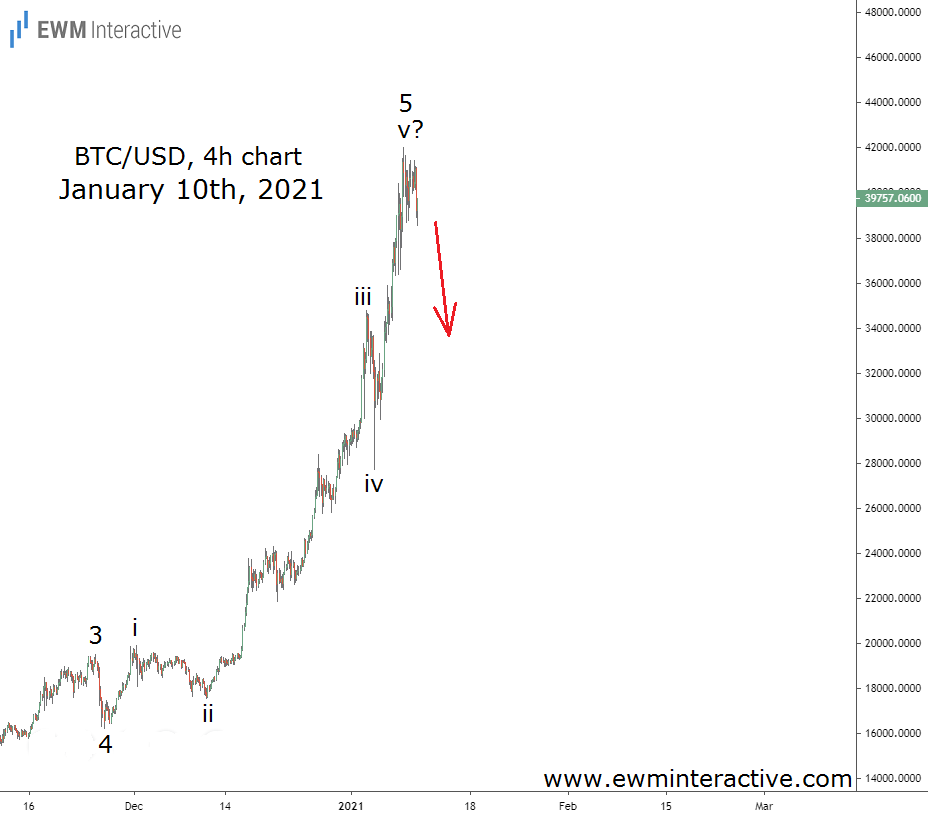
It was Jan. 10 and the price was slightly below $40k. Bitcoin’s 4-hour chart revealed a clear five-wave impulse from $16 218 to $42k. This pattern did not occur in a vacuum, of course. It had its place within our big picture outlook shared with subscribers that day. It wasn’t a short call, either, as we’re always against top picking.
What Makes Bitcoin Attractive Also Makes it Impractical
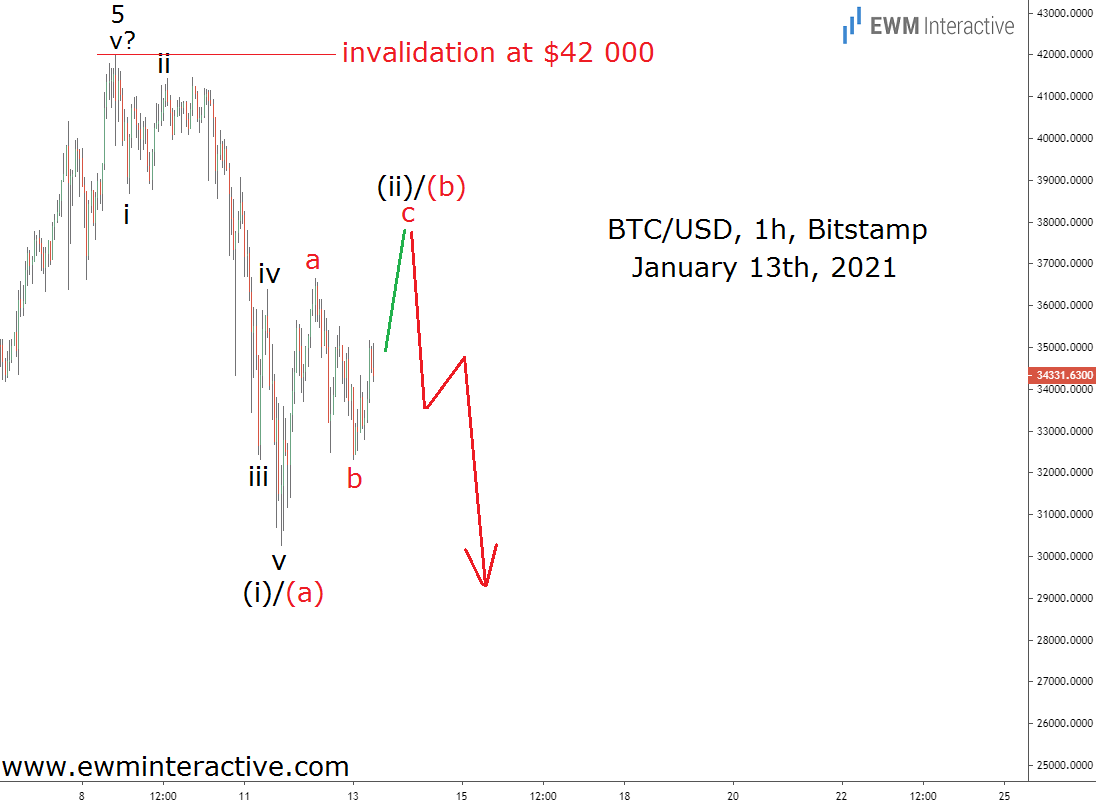
This was simply a suggestion that staying aside was preferable, since a correction follows every impulse. Three days later, when the time to send our Wednesday updates to clients arrived, Bitcoin was already down to $34 300.

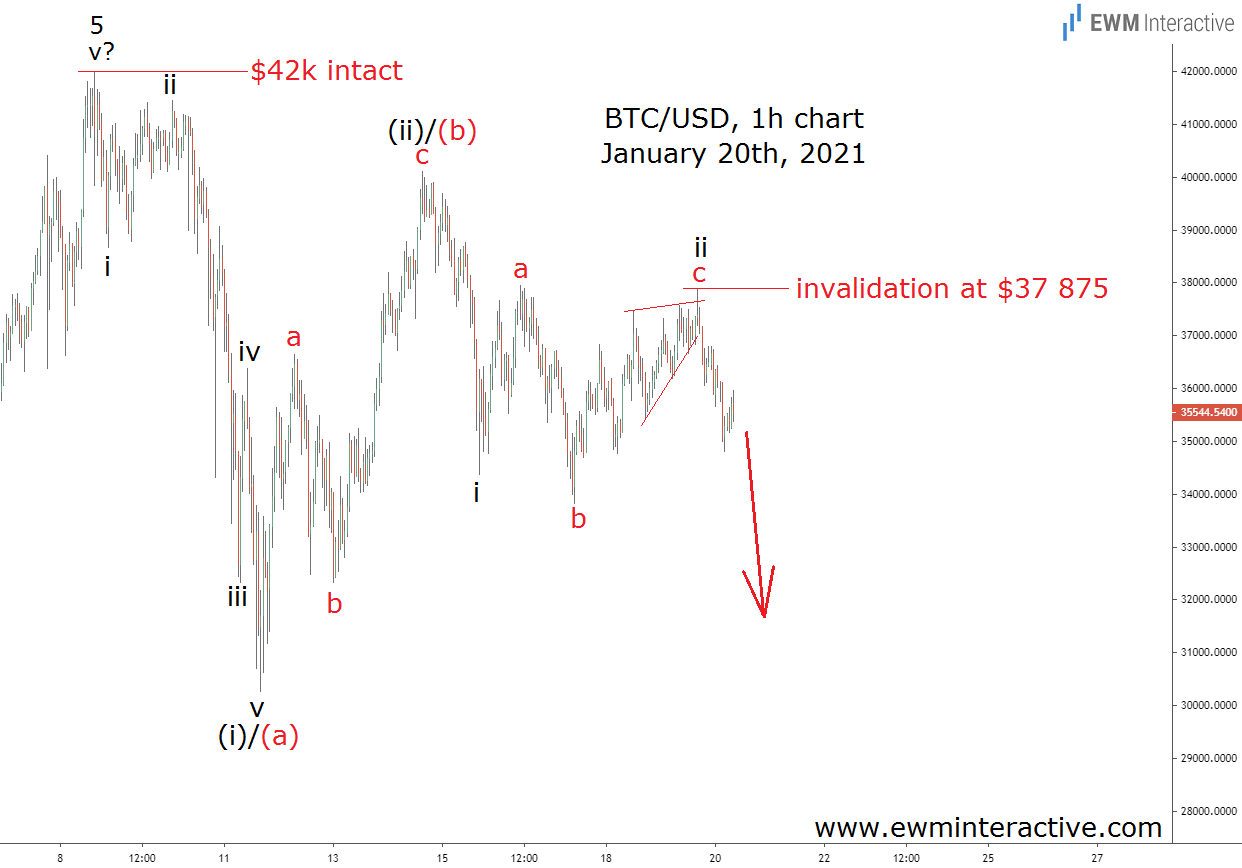
BTCUSD fell to $30 261 on Monday, Jan. 11. The decline, although not very clear, could be seen as an impulse pattern, labeled i-ii-iii-iv-v. This meant the following recovery was most likely part of a three-wave correction in wave (ii)/(b). As long as $42k remained intact, another selloff in wave (iii)/(c) was supposed to occur. A week later, it was already in progress.

Wave (ii)/(b) ended at $40 113 on January 14th. The rest of the development, we though, must be part of wave (iii)/(c). And since the bears’ initial targets stood below the bottom of wave (i)/(a), it made sense to expect more weakness to sub-$30k. This chart also allowed us to move the invalidation level from $42k down to $37 875. With Bitcoin at $35 500, the risk/reward ratio was not bad at all.

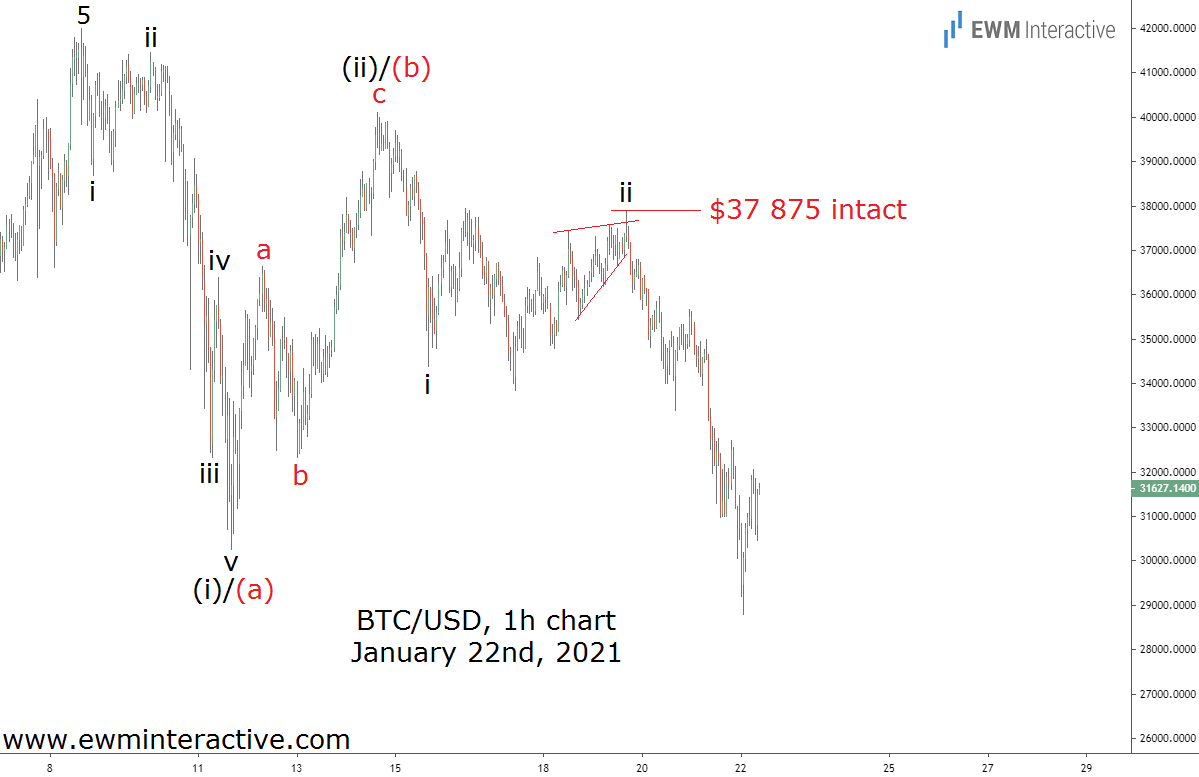
The price of Bitcoin continued to decline. The bears breached the $30k mark earlier today and even made it to $28 800 so far. From the top at $42k, that is a 31.4% drop in less than two weeks. In our opinion, that extreme volatility makes Bitcoin’s adoption as a widely-accepted form of payment highly impractical. Imagine Apple (NASDAQ:AAPL), Coca-Cola (NYSE:KO) or Unilever (NYSE:UL) taking the risk of losing 30% of the value of their sales in days simply because of an unstable currency…
