Stocks finished the day, Wednesday, around flat, mounting a pretty big comeback from an early morning drop on the heels of a Bitcoin meltdown.
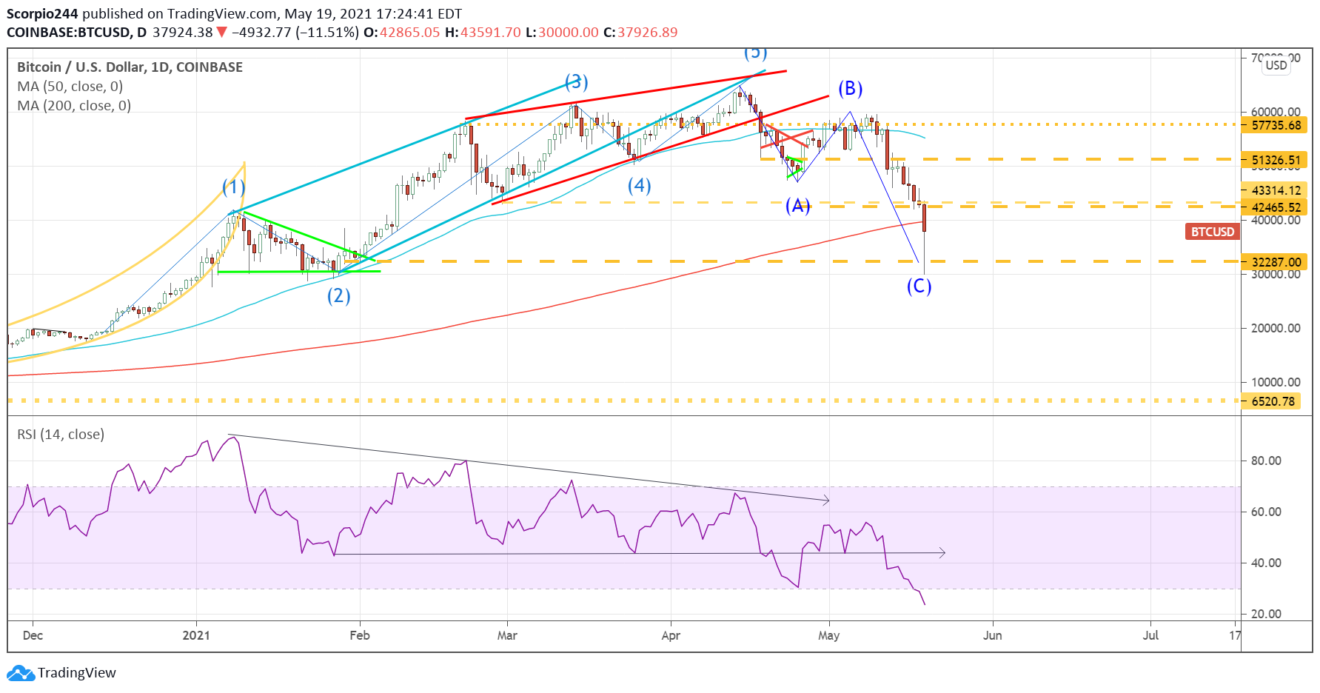
The meltdown was pretty intense, with the crypto falling all the way down 30,000ish, a drop of more than 20%. As of the time of writing, it was still down 11%.
Typically, we see bottoms retested, so it would not be surprising at all to see Bitcoin retest those low 30,000s again at some point soon.
It is technically “oversold” on the RSI; we should see a move higher, probably back to 42,000. That retest should result in Bitcoin then dropping again back to 30,000.
The real problem with Bitcoin is that there is no way to value it; there is no way to say, hey, this thing looks cheap if earnings are going to be X.
There is nothing.
As for a hedge against inflation? Not working so well either.
To me, there is no difference between Bitcoin and Tulips. Blockchain seems interesting. But anything, as in crypto’s, that can be created with such ease, is the first red flag.
It feels like a new coin comes out regularly, and as long as there is no barrier to entry, their supply can be unlimited, which means they can all easily be worthless.
Yields
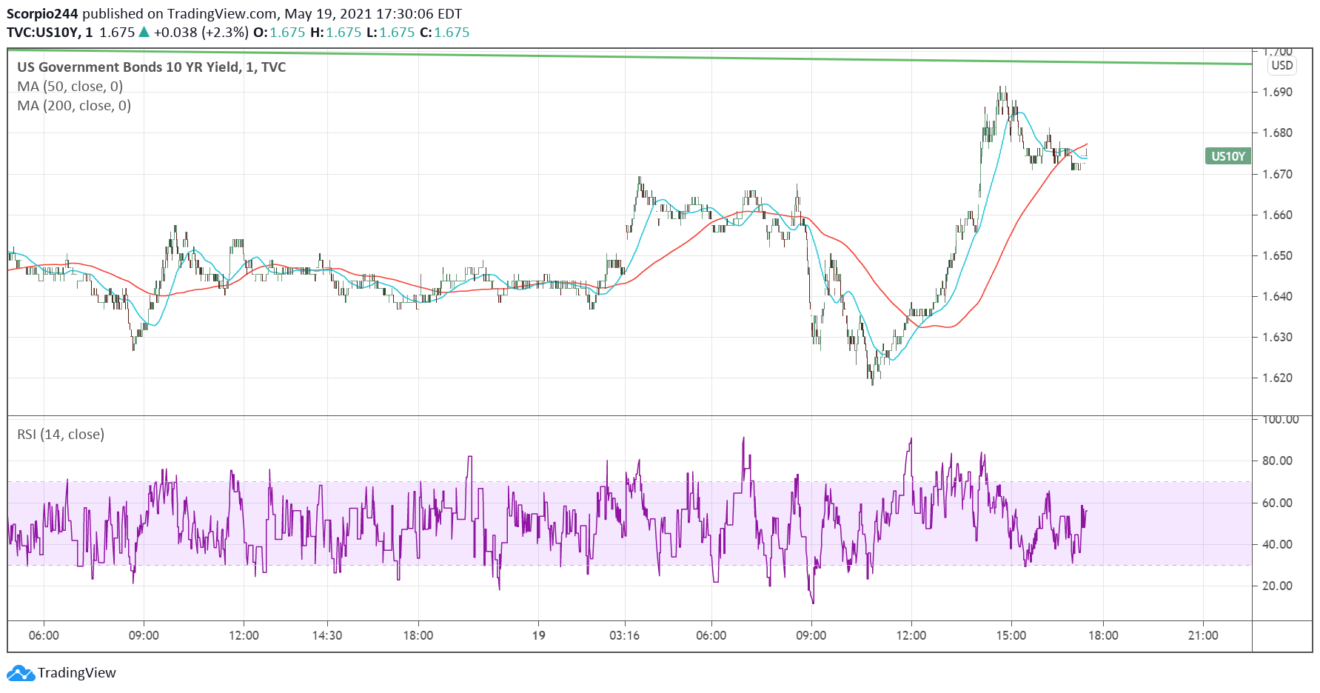
Bond yields moved sharply higher following the Fed minutes. It seems pretty clear that the Fed will start talking about tapering with Fed Chair Jerome Powell giving the nod at Jackson Hole.
There was a subtle hint towards taper coming, although it was buried and written in typical cryptic Fed language. At the very least, this idea that the Fed will never taper died yesterday, and it is just a matter of when they start.
Once the 10-yr breaks 1.76%, I think there will be a rapid move higher to 2%. That should rattle equity markets.
The big move was in the TIPS, with the 5 and 10-year TIPS both rising by roughly 10 bps. If TIPS finally starts to move, it will be the biggest signal yet that the bond market sees a taper and eventually hiking cycle coming.
It could result in the 10-yr TIP rising all the way back to 0 bps, from their current negative 80 bps. That would push the 10-year nominal rate easily over 2%, perhaps to as high as 2.5%, based on current market 10-yr inflation expectations. 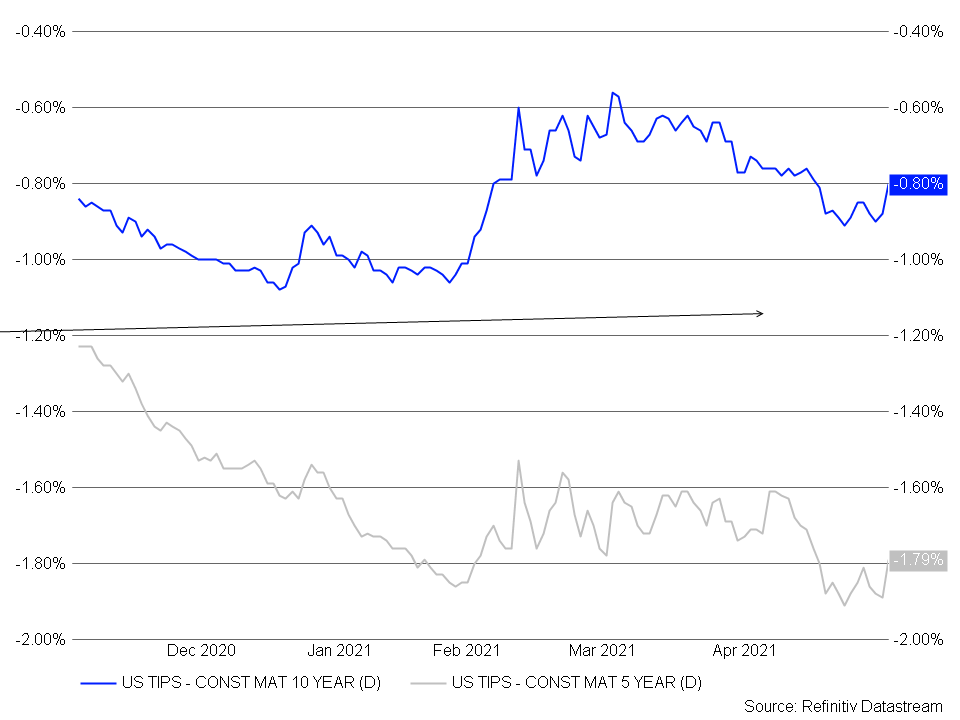
Copper
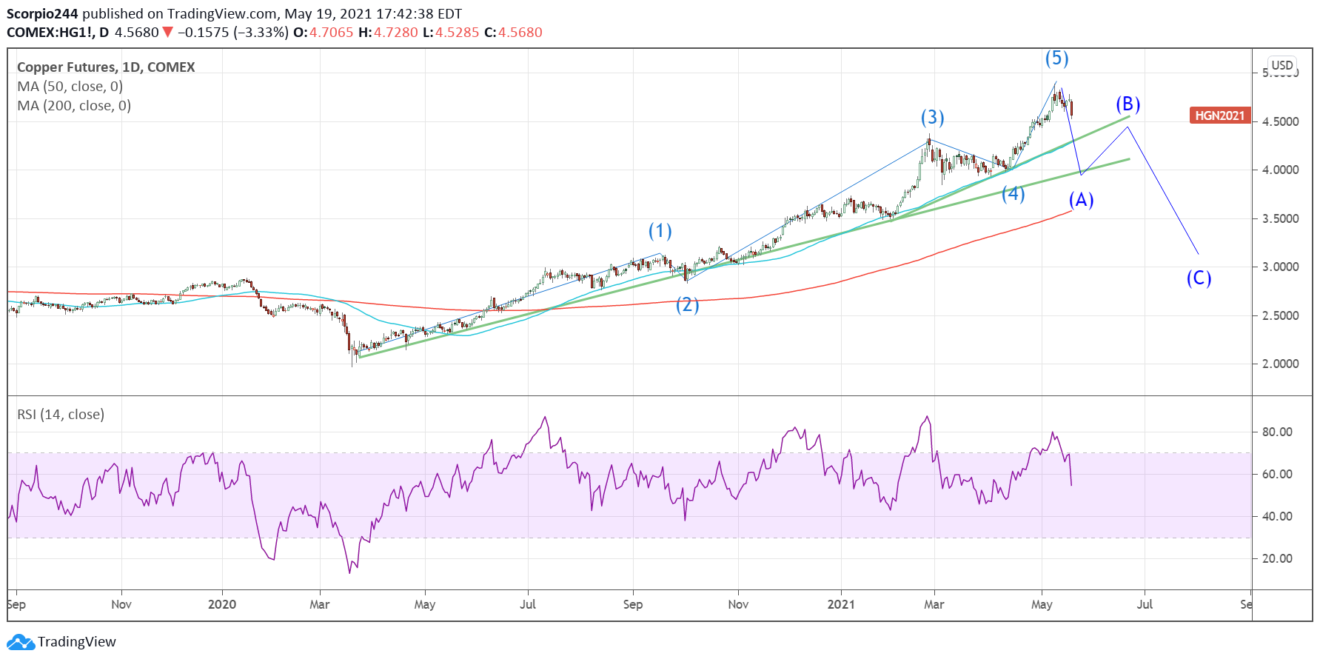
I think the run-up in copper is over, and we should see a pretty big correction in the months ahead. For now, the first stop is likely back to $3.95.
Risk
Copper, lumber, Bitcoin are all pointing to the same thing, a significant shift in the risk-on mentality of the markets. Don’t kid yourself into thinking otherwise.
S&P 500 (SPY)
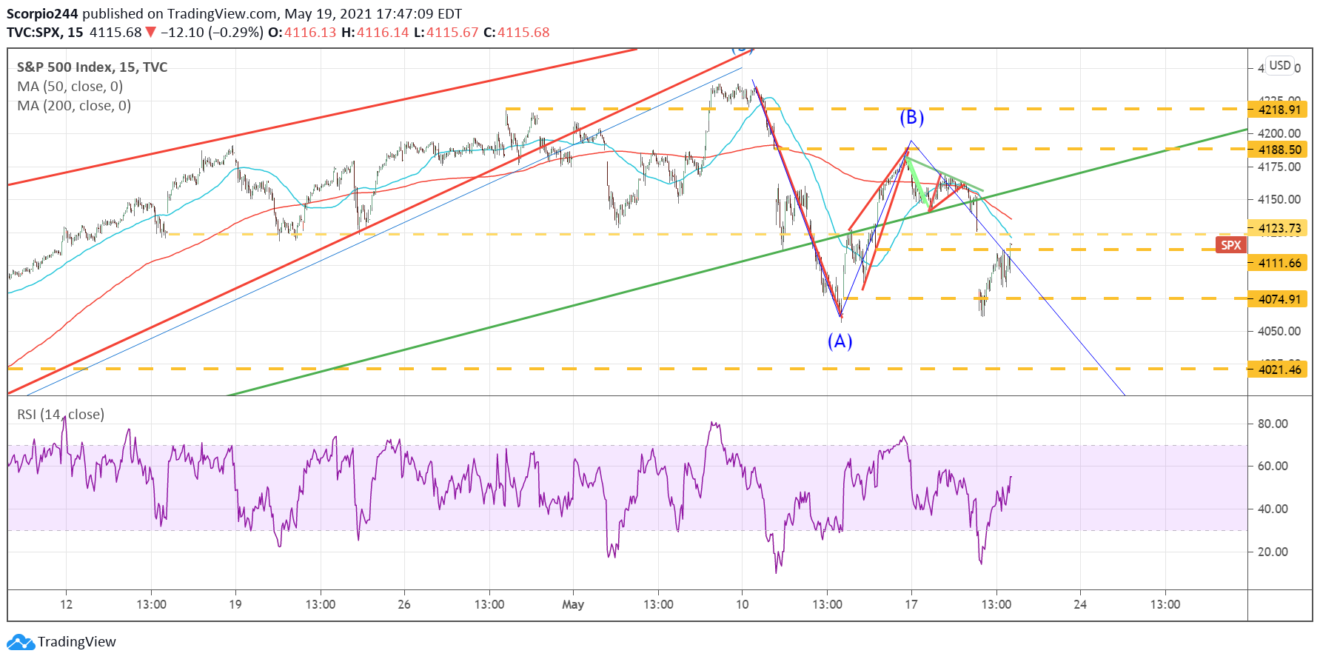
The S&P 500 managed to finish the day around 4,115. I think option expiration had a lot to do with yesterday's comeback.
The 4,100 level is the big gamma level for now, and the index never got low enough to really escape the gravity of 4,100. From a technical standpoint, the index looks as though it is merely filling the gap.
If this is just a gap fill, we should reverse lower once the gap is filled at 4,125. Additionally, volatility is likely to come on Monday once all of May’s options gamma rolls off.

