In my last two articles (see here and here) I have kept you abreast of where Bitcoin (BitfinexUSD) should top and bottom by using the Elliott Wave Principle (EWP) and Technical Analyses (TA). Combined and applied correctly, it is still one of the best ways to analyze and forecast markets, although, it is not falable. The question now is, what is next?
To answer that question, let's first go back to last week, where I found.
"BTC … should bottom soon (next few days) and then rally to new ATHs between, ideally $55-60K, in the subsequent weeks. The bulls will be in trouble on a weekly close below $28.4K as that can target the next lower support zone at $23-22K"
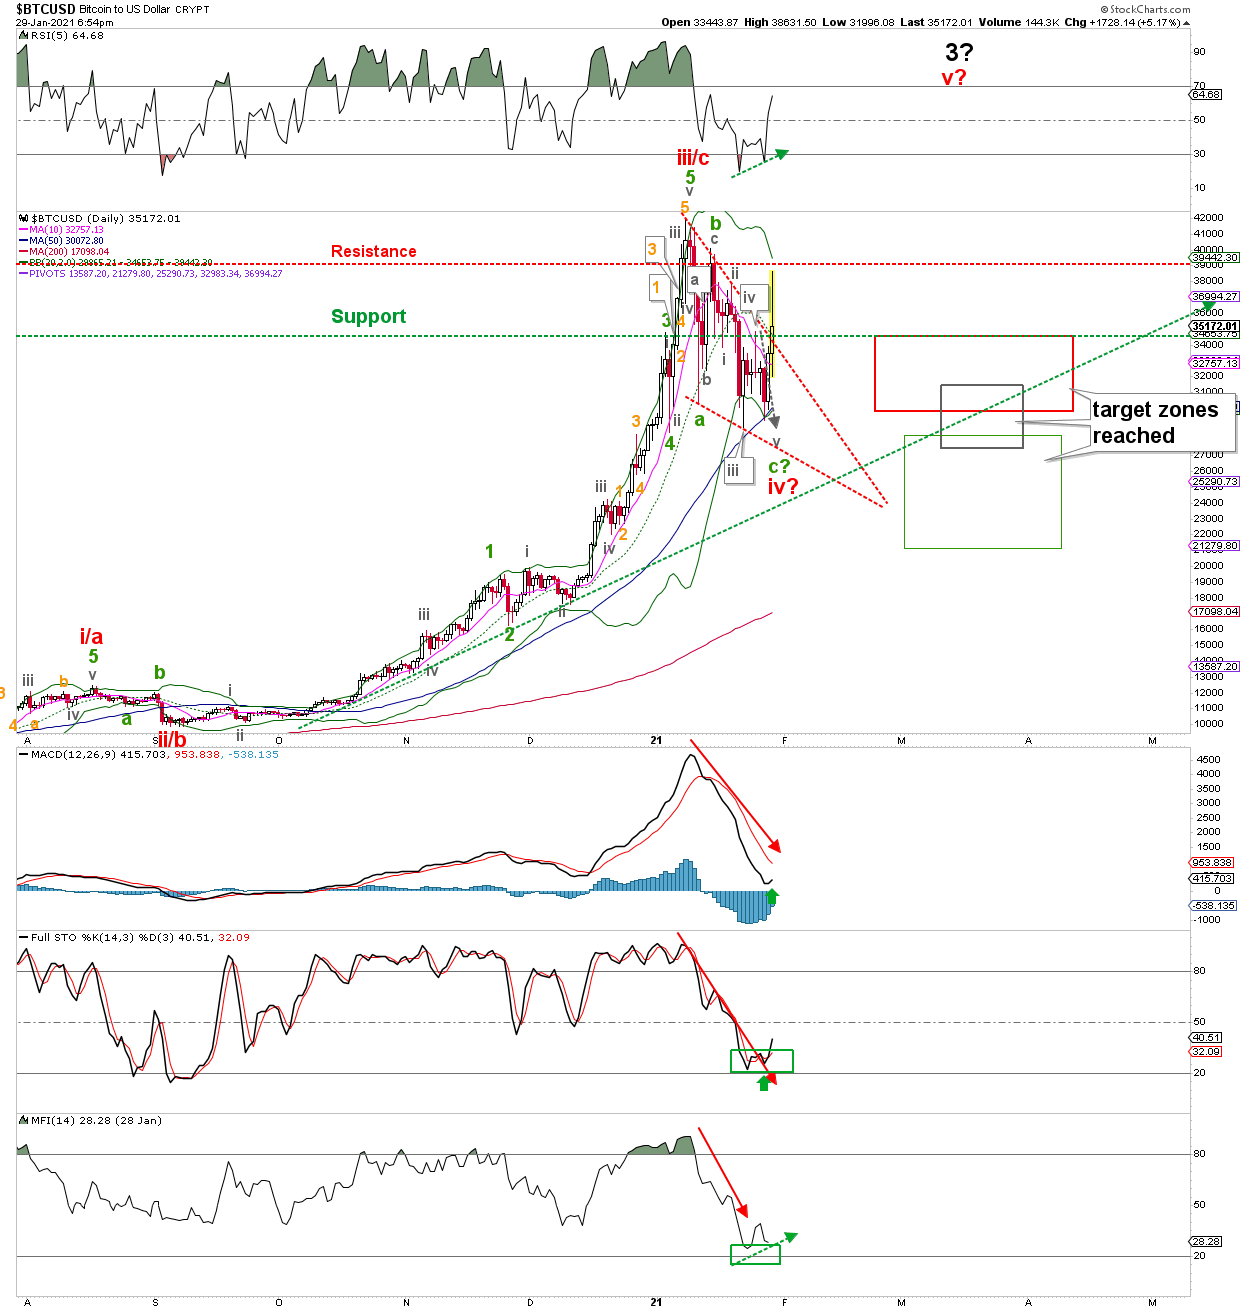
So far so good, BTC bottomed on Wednesday at $29,236, which fits very well with last week's insight that "at around $29,700 is the preferred target zone" and "$29K+/-1K as a more likely support zone for the wave-iv." Besides, it appears to have completed a wedge-shaped pattern, which can be called a bull flag. Price always moves powerfully out of such patterns, like today. Thus, as long as this week's low holds, we should expect BTC to start reaching for $55-65K for (red) intermediate-v of (black) major-3. See the upper right corner of the daily chart below.
Figure 1. Daily Bitcoin candlestick chart, with detailed EWP count and technical indicators:

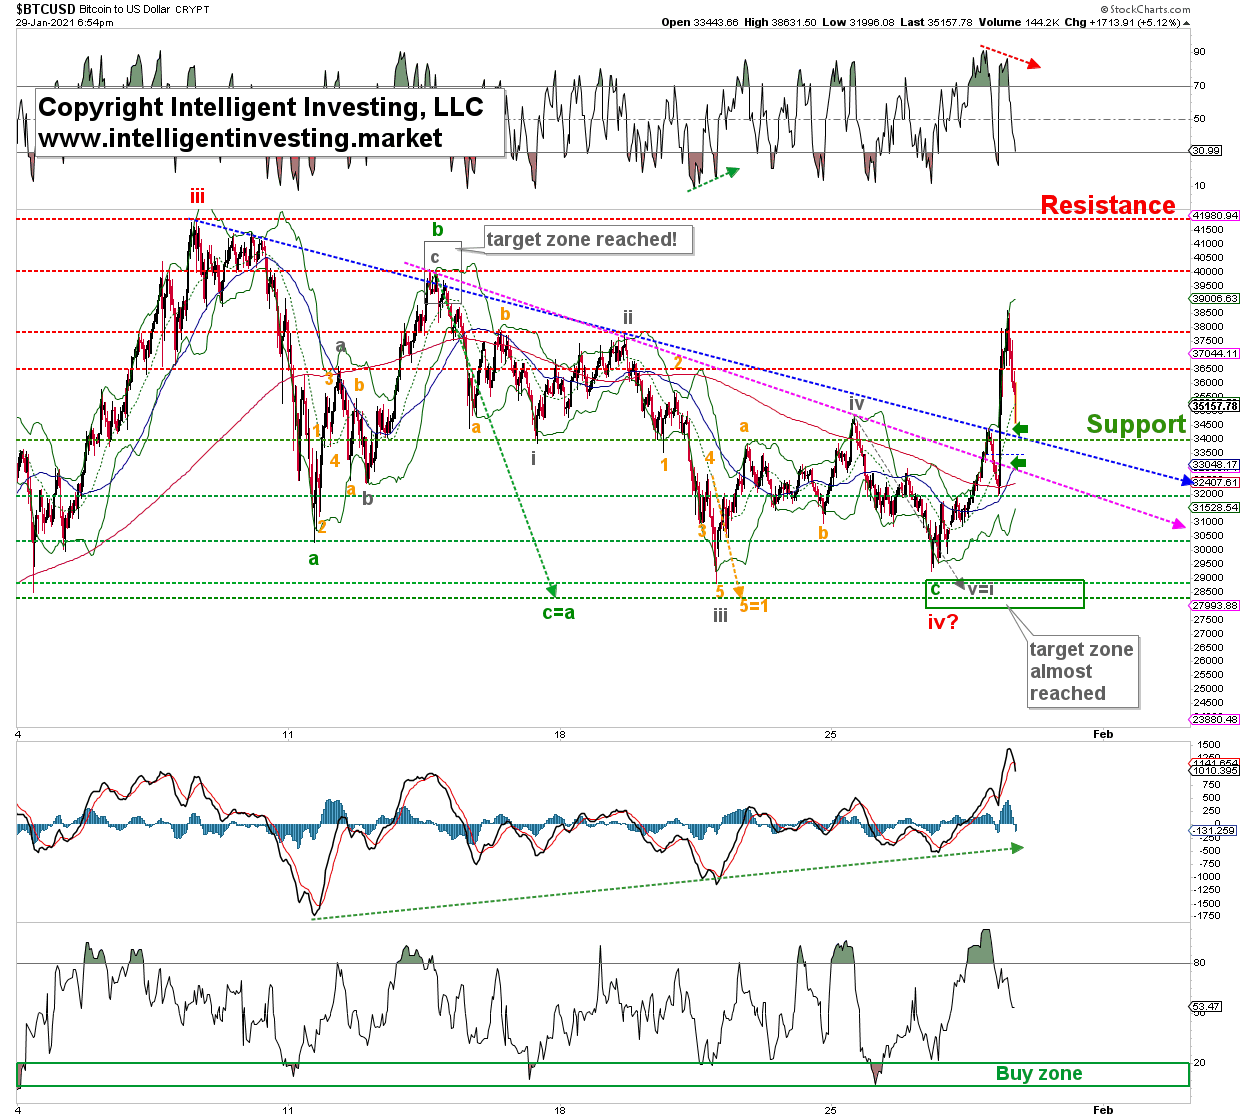
For those of you who like a bit more detail and lower resolution to allow quicker trading, the hourly chart below shows my micro-EWP count since the ATH was struck early-December last year. From a technical analyses' perspective, there was a nice positive divergence building on the hourly MACD (dotted green arrow). The price has broken above the blue downtrend lines (small, green arrows). Thus, so far, the breakout is technically sound. Besides, from an EWP perspective, BTC completed five (grey) waves down from the $40K bounce high and reached almost the ideal (green) c=a, (orange) 5=1, and (grey) v=i targets. But in bull markets, downside disappoints and upside surprises, though $29,236 vs. $28,500 +/-500 and is still well within the margin of analytical error.
Figure 2. Hourly Bitcoin candlestick chart, with detailed EWP count and technical indicators:

Bottom line: If this week's low holds, BTC should be on its way to $55-65K. If this week's low is broken, then the current correction is becoming more complex, and the next lower support zone at $23-22,000 should then be expected before the next rally starts.
