In my last article from 10 days ago, Bitcoin was trading at about the same levels as now: down 25% from its recent all-time-high. Using the Elliott Wave Principle (EWP) and Technical Analyses (TA) combined, I found:
“I prefer to see the current decline as a (red) intermediate wave-iv, which should ideally bottom around the 38.2% retrace of the entire (red) intermediate wave-iii rally that started since the September 2020 low: $29,680.”
“I view this wave-iv as a multi-week event, and I, therefore, expect at least a bounce back soon to around $36,130-39,210 before the next leg lower starts. That would complete a simple a-b-c lower, but 4th waves are known to be notoriously tricky and could morph into something more complex, such as a flat or a triangle (see here). We’ll have to deal with that as it unfolds.”
And:
“For now, the short-term downside risk seems to be small as several indicators are already close to oversold.”
What did we get?
BTC bottomed that same day, rallied to $40,093 over the next three days (I was off by 2.3% only) in an overlapping, three-waves fashion: b-wave. And since that high, it started a second decline: A more extensive “simple a-b-c lower” is now unfolding as anticipated. Thus, that’s three-out-of-three correct: the power of EWP and TA combined. It’s not fool-proof, no method is, but it is one the most reliable ways to assess and forecast financial markets.
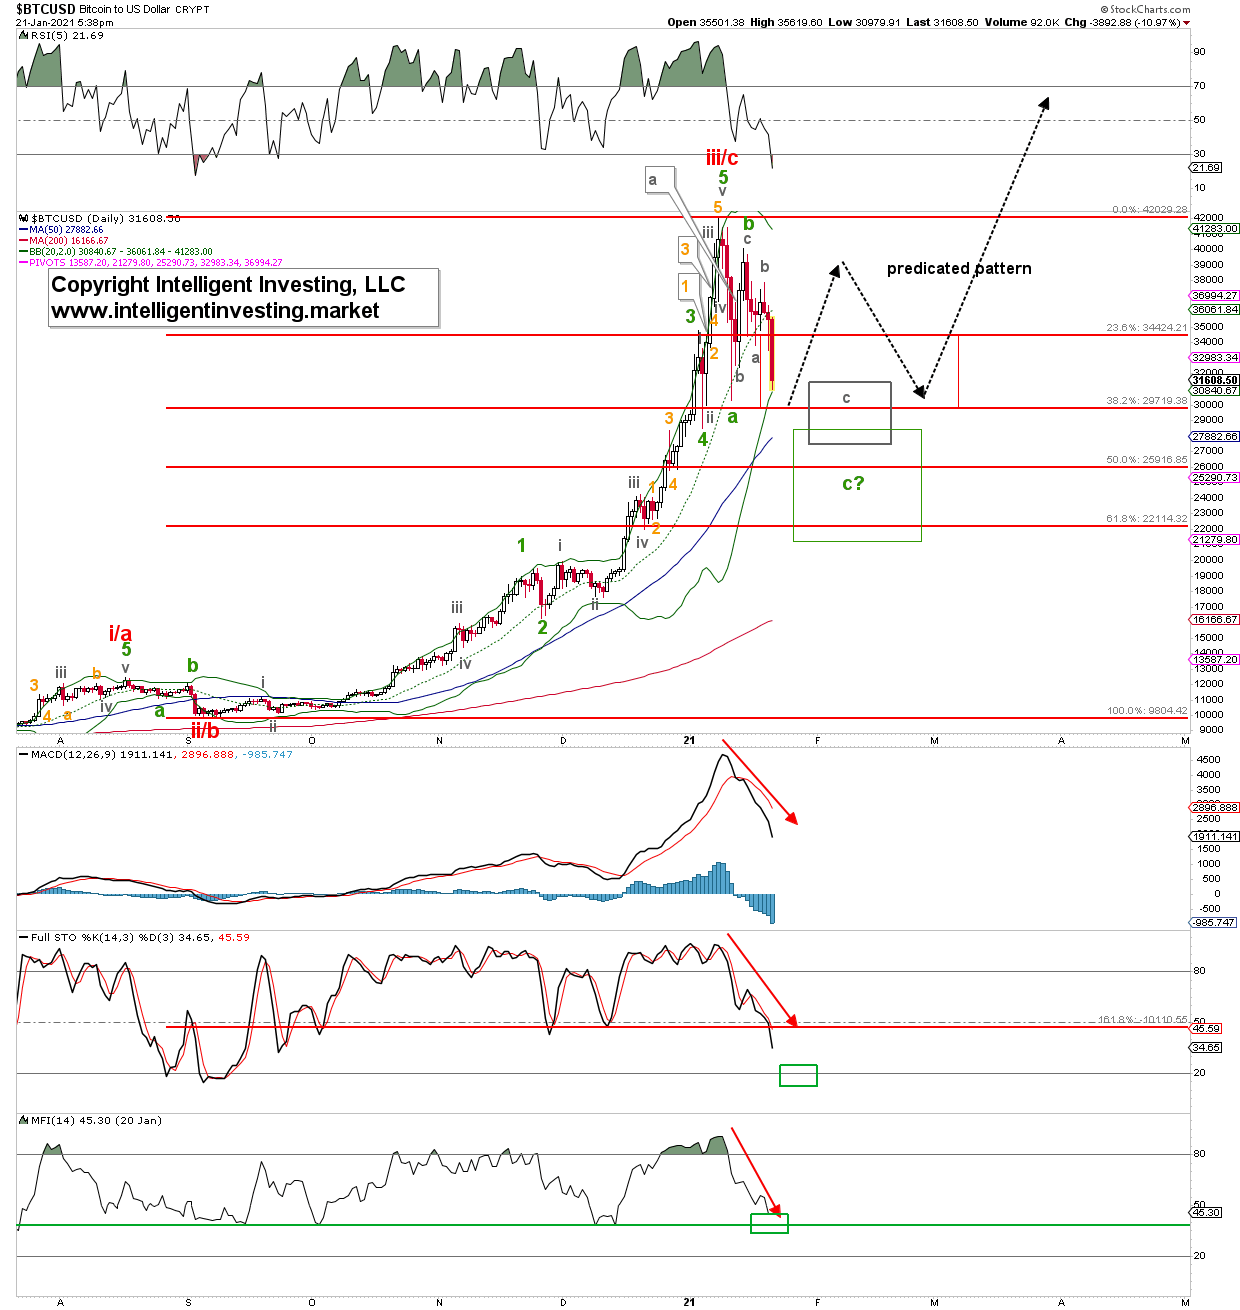
Figure 1. Daily Bitcoin candlestick chart, with detailed EWP count and technical indicators:

That said, the black arrows show the project path I had laid out for my Premium Cryptocurrencies Members, and so far, this is panning out as anticipated. I still expect BTC to bottom out soon in the red, grey- or even possibly the green target zones. The overlap of the red- and green target zones at around $29,700 is the preferred target zone and still in line with my previous article, where I “view the $29K+/-1K as a more likely support zone for the wave-iv.” And remember, in bull markets, we often have “upside surprises and downside disappointments.” A break and close below $28,400 is the first warning of worse things to come as then next support is not until $22-23,000.
The technical indicators on the daily time-frame are now close to oversold and have not been as oversold since the September 2020 lows. That low was at the intermediate-wave-degree. Thus, the current readings match the preferred view that the recent decline is of the same degree: an intermediate wave-iv and should be close to bottoming. Once complete, I expect a sharp rally (several weeks) to ATHs (think $50-60,000).
Bottom line: BTC has so far followed a classic, standard, three-wave corrective pattern to the ideal $29+/-1K target zone for an intermediate wave-iv. It should bottom soon (next few days) and then rally to new ATHs between, ideally $55-60,000, in the subsequent weeks. The bulls will be in trouble on a weekly close below $28,400 as that can target the next lower support zone at $23-22,000.
