Bitcoin has essentially not gone anywhere since late February. So what is going on?
Using the Elliott Wave Principle (EWP) combined with technical analysis, we can see that BTC has likely been in an irregular flat correction since hitting its late February top.
Flat corrections consist of three larger waves: one wave down (a), followed by one wave one up (b), and a subsequent wave down (c). They are called “flat” because the instrument is essentially mainly moving sideways. It is a typical side-ways consolidation pattern after a long runup, which shows buyers are still in control, but some profit-taking is taking place before the next runup kicks in.
In addition, waves a, b, and c, of a flat are made up of smaller waves as well: wave-a consists of three waves, wave-b as well, but wave-c consists of 5 waves. Thus, in more detail, after the runup peaks, often a strong 3rd of a 3rd wave, the instrument will see a 3-3-5 move.
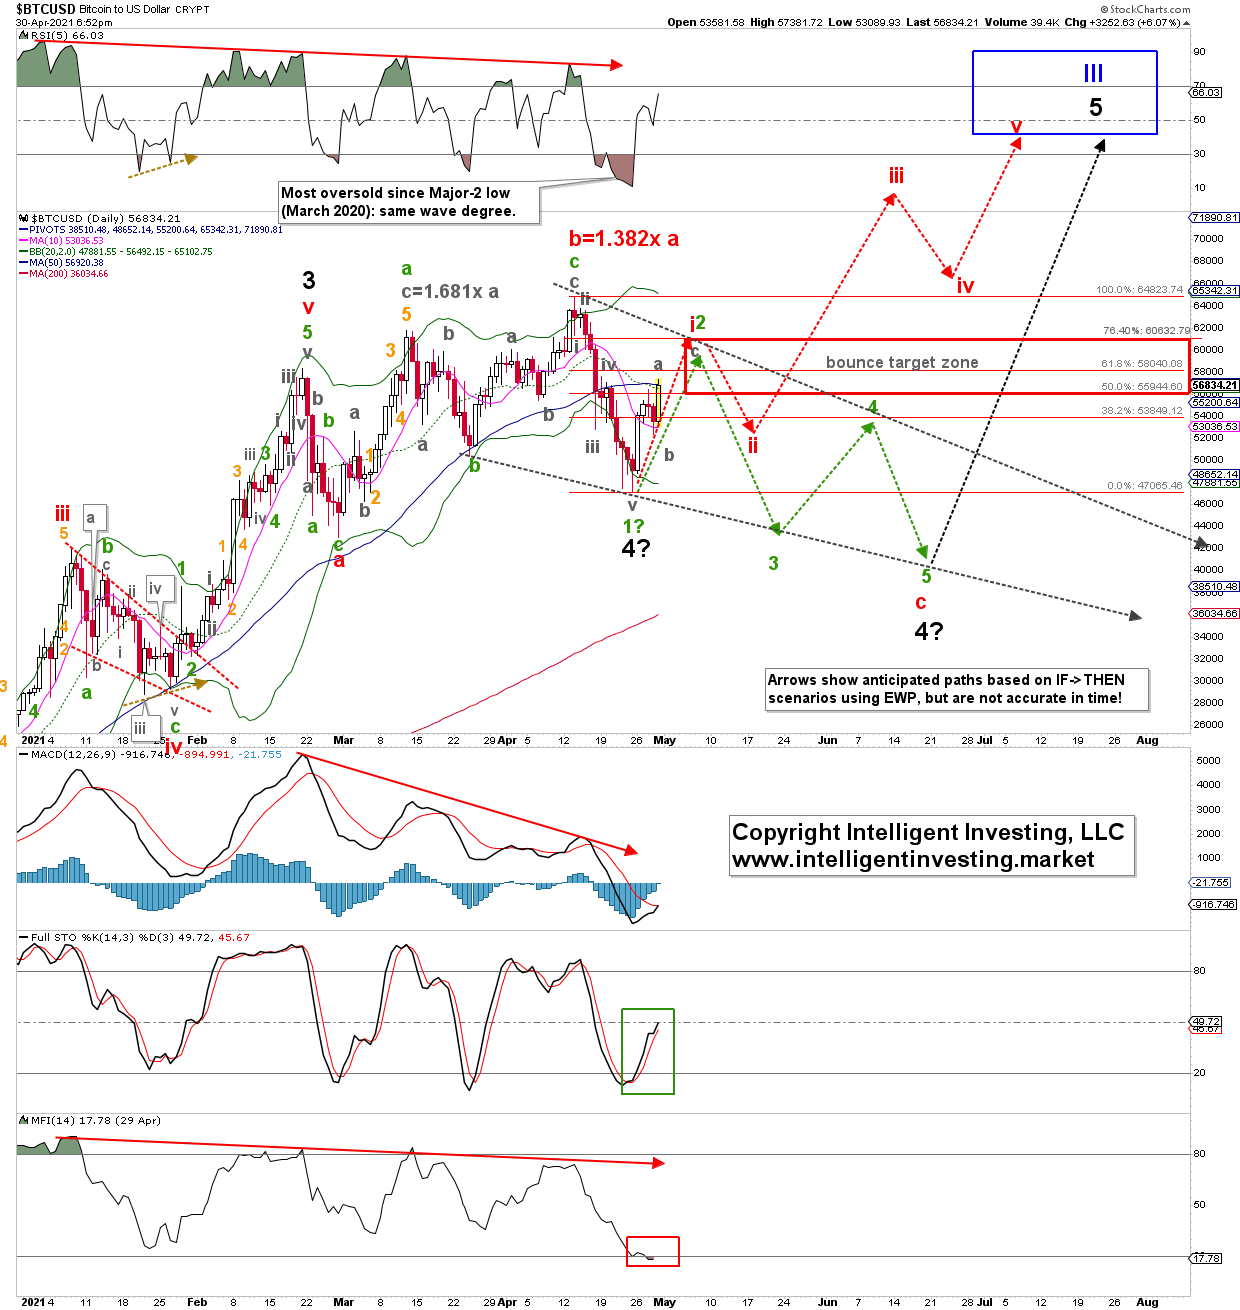
Let’s put this EWP to the test. See figure 1 below.
Figure 1. Daily Bitcoin candlestick chart, with EWP count and technical indicators:

Bitcoin topped in mid-February, declined into late-February, then rallied into mid-April. Besides the last week, it has been falling since. Thus, this describes a down-wave followed by an up-wave and now in another down wave. The first decline (red wave-a) consisted of three smaller waves: green waves a, b, c. From late February into mid-April, the rally comprised three waves: green a, b, c. With the internals of those waves matching typical Fibonacci-extensions. The mid-April all-time high was 1.382x the length of the February decline, a special relationship between wave-a and wave-b in an irregular flat.
The subsequent recent decline to around $47,000s consisted of five (grey) smaller waves. Thus, for now, there’s been a 3-3-5 move since the late February high. This means two things: either the flat correction is over, and a run to new ATHs is under way (red path). Or, these smaller five waves are only the start of a more extensive five-wave down sequence (green route). How do we know which option is operable?
Simple: If the price of BTC stalls at around $60000 +/- 1000 and then starts to decline, the green path is operable. But if the price continues to rally past the upper end (>$61K), then the red course is most likely, and BTC should be on its way to $90K+.
Bottom line: Since financial markets are all about the possibilities of probabilities, Bitcoin is at a crossroads. It can decide to rally a little more before declining to the $40,000 region, but possibly as low as the $30,000 level. Or, it chooses to rally rather directly to new ATHs. We will know over the next few days which it is. Either option will be a great buying opportunity, so now may be a good time to be patient and let the market tell us where and when to place a low-risk, high-reward trade.
