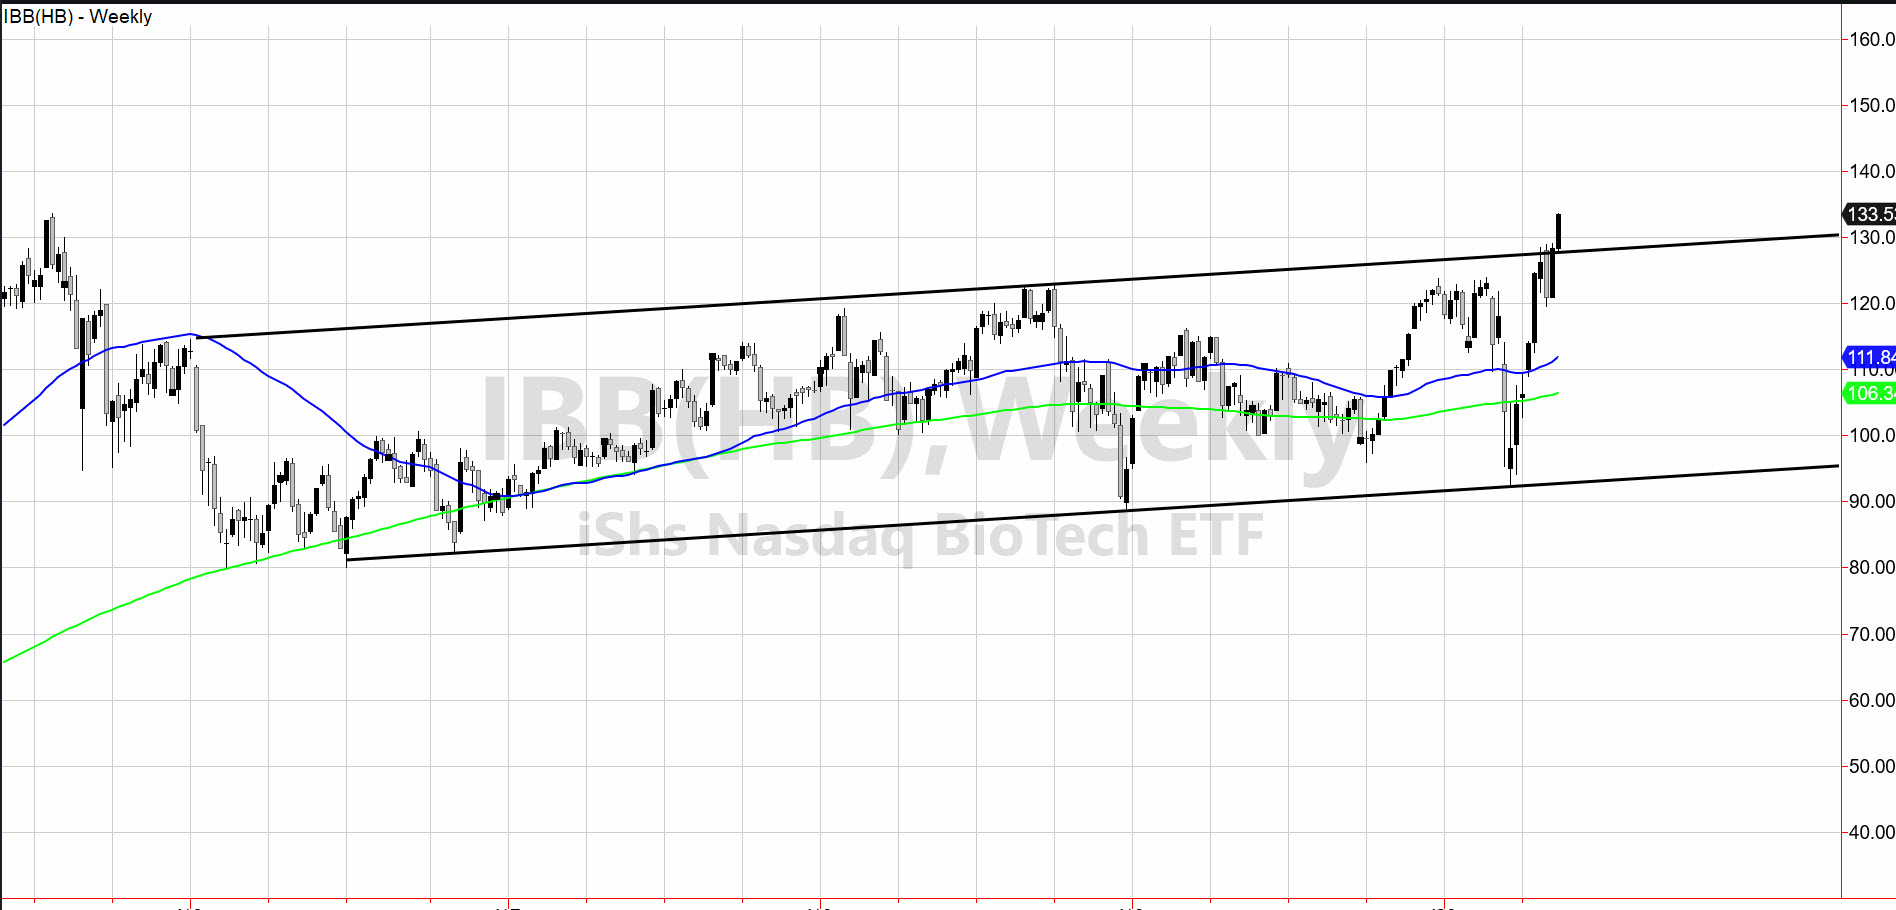
A week ago, I wrote regarding the Biotechnology ETF Channel.
I began by writing,
“If there is one area to watch should the market have another run-up, it is IBB.
The channel lines that are perfectly parallel, go back to 2015.
Since this is a weekly chart, what matters most is the weekly close.”
Last Friday, IBB did eek out a close above the weekly channel closing at 128.41.
Therefore, no surprise that yesterday, IBB took out the 2015 highs and rose over 4%.
Where might it go from here?
What makes this a tricky environment is that the indices are not near all-time highs. Even NASDAQ 100 is up on the year, but all-time highs are at 237.47.
When you look at the Russell 2000 IWM or the DIA, both have improved, but neither is anywhere near their all-time highs.
That makes you wonder, who do you believe?
Furthermore, do we discount the old-world order and make way for the new one where technology designed to keep us away from others reign supreme, while the old essentials become obsolete?
Now, if we flip that logic, IBB until yesterday, made its all-time high in 2015, whereas most of the other sector ETFs did so in 2018-2020.
Does that mean that this sector too, is part of the new world thereby, running on its own fumes?
If so, then perhaps IBB has a lot more upside regardless of IWM or DIA.
This much is clear. 128 is a good line in the sand.
S&P 500 (SPY) 294.88 last swing high. 288.00 support
Russell 2000 (IWM) 128.50 support 136.85 last swing high
Dow (DIA) 240 support 247.67 last swing high
Nasdaq (QQQ) 229.32 a gap to fill. 220 support
KRE (Regional Banks) Looks weak until it can clear and hold 36.50
SMH (Semiconductors) 133 support 139.36 last swing high
IYT (Transportation) Has to hold 143.50. 155.60 last swing high
IBB (Biotechnology) 128 major support
XRT (Retail) 38.43 last swing high. 36.80 support
LQD (iShs iBoxx High yield Bonds) Broke the 50-DMA which could be a bad sign for the market
GLD (Gold Trust) 3rd inside week-big which way it breaks.
