Biotech Stocks Are Ready To Soar

Published 12/12/2017, 06:20 AM
Updated 07/09/2023, 06:31 AM
IBB
-
NBI
-

This week’s Chart of the Week features IBB (NASDAQ Biotechnology Index ETF). The chart for iShares Nasdaq Biotechnology (NASDAQ:IBB) is displaying multiple bullish indicators which has led us to the prediction that IBB is heading to $115. We are looking at the one year chart here and the first thing that stands out is the clear divergence between stock price and the RSI. This is an indication of a gap higher that is soon to come and confirmation that the bottom from the recent move lower has been set. Additionally, support was held twice at $101.28 and the ETF is preparing to test the upper end of a near term channel at $106.68, which we do expect to break.

The other momentum indicator that we are looking at this week is the MACD and half way through November we saw a clear cross in the indicator. This is generally a signal of a shift in momentum and it clearly marked the bottom at $101.28 a couple weeks ago. That said, we are looking to break $106.68 this week and gap up to resistance at roughly $110 by year end. Once reaching $110, we may see a small pullback to ~$108 and eventually continue to our $115 target by mid-January.
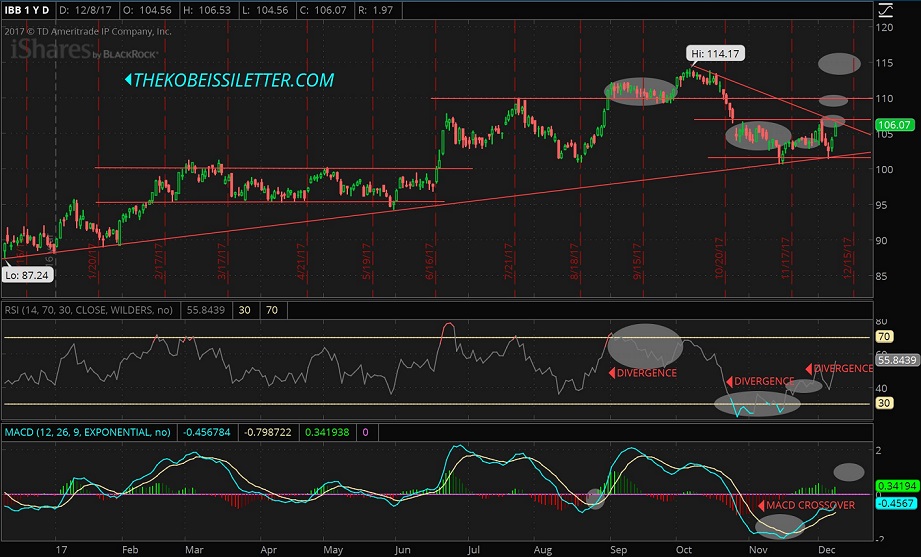
IBB 1-Year Daily Chart

Disclosure: None of the information or opinions expressed in this blog constitutes a solicitation for the purchase or sale of any security or other instrument. Nothing in this article constitutes investment advice and any recommendations that June be contained herein have not been based upon a consideration of the investment objectives, financial situation or particular needs of any specific recipient. Any purchase or sale activity in any securities or other instrument should be based upon your own analysis and conclusions.

Latest comments

Loading next article…
Risk Disclosure: Trading in financial instruments and/or cryptocurrencies involves high risks including the risk of losing some, or all, of your investment amount, and may not be suitable for all investors. Prices of cryptocurrencies are extremely volatile and may be affected by external factors such as financial, regulatory or political events. Trading on margin increases the financial risks.
Before deciding to trade in financial instrument or cryptocurrencies you should be fully informed of the risks and costs associated with trading the financial markets, carefully consider your investment objectives, level of experience, and risk appetite, and seek professional advice where needed.
Fusion Media would like to remind you that the data contained in this website is not necessarily real-time nor accurate. The data and prices on the website are not necessarily provided by any market or exchange, but may be provided by market makers, and so prices may not be accurate and may differ from the actual price at any given market, meaning prices are indicative and not appropriate for trading purposes. Fusion Media and any provider of the data contained in this website will not accept liability for any loss or damage as a result of your trading, or your reliance on the information contained within this website.
It is prohibited to use, store, reproduce, display, modify, transmit or distribute the data contained in this website without the explicit prior written permission of Fusion Media and/or the data provider. All intellectual property rights are reserved by the providers and/or the exchange providing the data contained in this website.
Fusion Media may be compensated by the advertisers that appear on the website, based on your interaction with the advertisements or advertisers.
© 2007-2025 - Fusion Media Limited. All Rights Reserved.