
Narrative In Financial Markets
The massive headline beat in last Friday’s U.S. NFP led to solid flows into the USD as the U.S. fixed income enters a micro bear steepener phase -improved outlook -. One can notice the low rate of change in the average hourly earnings to 0.1% vs 0.3 exp MoM (bad). The unemployment and underemployment rate also rose as participation climbed. As I mentioned last Friday, “the U.S. jobs market is no longer the number 1 driver of Fed policies, the stabilization of the stock market is, hence any NFP-led vol should be taken with a bucket of salt, especially in a macro bear steepener U.S. yield curve.” Raoul Pal, Founder at Realvision, also nails it by noting that the December U.S. NFP is a lagging indicator to take the real pulse of the economy, as the chart below shows, with a lag over ISM of up to 4 months.
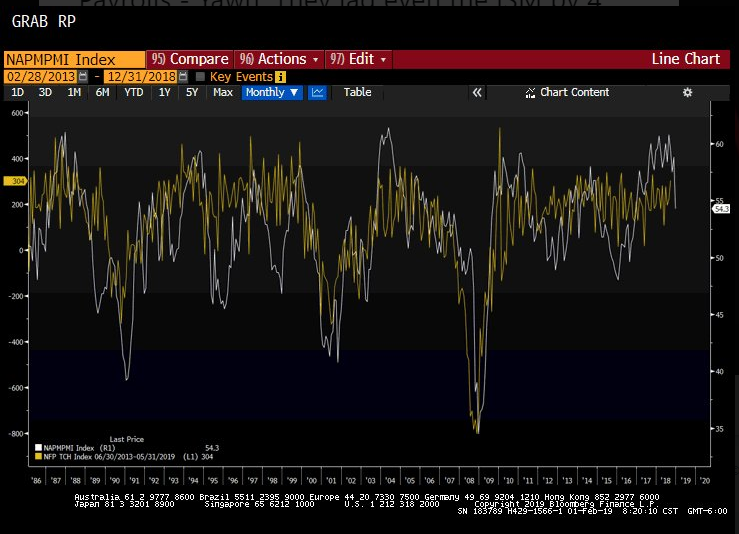
Source: @RaoulGMI
The January U.S. ISM Manufacturing index came at 56.6 vs 54 exp, which is a surprisingly strong rebound. The sharp fall in the survey series in December set up a very ugly backdrop but judging by the very strong recovery in new orders, which tends to be the most leading indicator, it portrays an improved outlook with a 58.2 reading vs 51.3 prior. Still, the U.S. dollar failed to gain as much ground as one would think given the decency of the latest U.S. fundamental readings — a strong EUR, CAD weighed -, which suggests, the market is still very much fixated about the overarching theme casting a shadow in the USD, that is, a more dovish Fed.
The U.S. and China can still afford one extra month to negotiate trade terms before the deadline of March 1st comes into effect. With so many underlying issues to cover — from IP, access to Chinese markets, reduction of the negative current account, yuan exchange rate, etc — one can easily picture talks headed down to the wire in order for the U.S. to work out the best possible terms. There is going to be an array of noisy headlines in between, but with an ultimate meeting between U.S. President Trump and Xi not planned for at least another 2 weeks — China’s golden weeks starts today—, expect the market focus to temporarily shift into other matters.
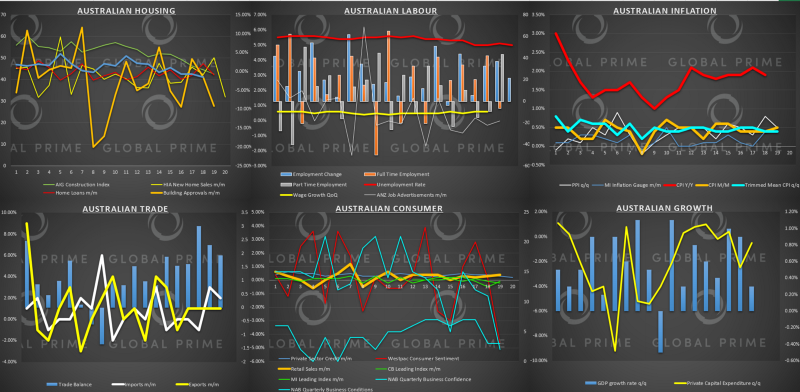
One currency poised to capture most of the market’s attention this week is the Aussie. The RBA monetary policy meeting is on Tuesday, followed by RBA’s Governor Lowe speech at the National Press Club in Sydney, and to top it off, we also get the RBA monetary policy statement, where further elaboration on the state of the economy will be discussed. If you are an Aussie trader, this is a pivotal week as the Central Bank is faced with renewed challenges after the deterioration in economic data. This has brought back headwinds and raised the prospects for a reduction in rates to provide a breather to households and incentivize a reinvigoration in consumption, areas that are starting to take its toll from falling Australian housing prices. Bond traders have been building up a dovish case as the bull flattening phase of the yield curve demonstrates (more below).
Another story that grabbed the market’s attention on Friday, even if the negative knock-on effects were well contained, is the awful reading in China’s Caixin Manuf PMI for Jan, down at 48.3 vs 49.6 exp. There has been a mountain of evidence about the dire state of the Chinese economy, from a slump in auto sales, reduction in imports/exports, less consumption, major flagship companies the likes of Apple (NASDAQ:AAPL) or Caterpillar (NYSE:CAT) suffering the consequences through downgraded estimated earnings or quarterly results respectively, and the list goes on. As in the case of the U.S., with the Fed caving in and ready to revert policy 180 degrees if/when needed, the underpinning factor keeping the downside limited in risk off is the more aggressive stance taken by the Chinese government, sending the right rhetoric to markets by keeping the liquidity ample even if that obviously implies an economic deleveraging as currently a mere illusion.
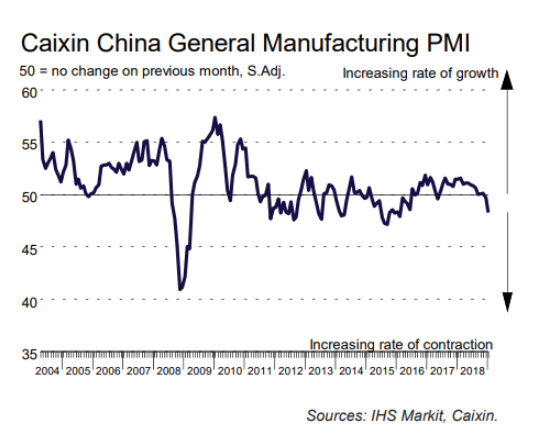
Source: Caixin
Find today’s events below. As you can clearly observe, which is also supported by the implied vol studies today (more below), narrow ranges are expected.
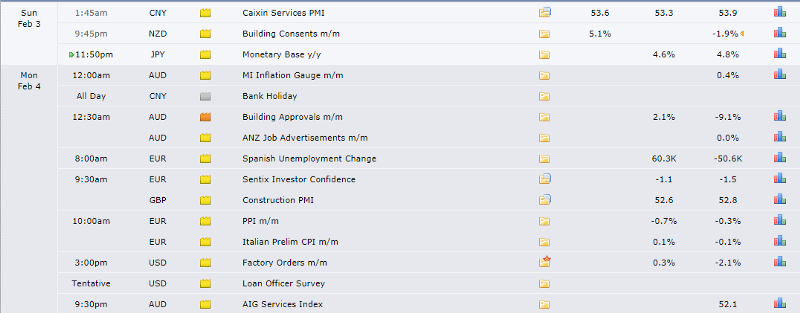
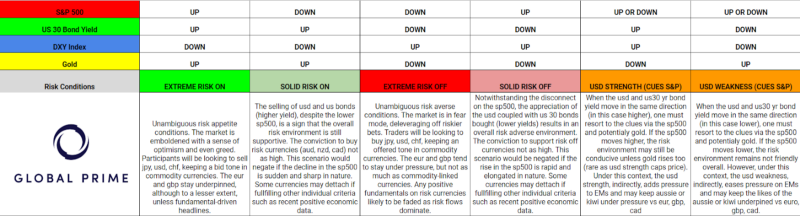
Source: ForexfactoryRORO Model: Risk-On Risk-Off Conditions
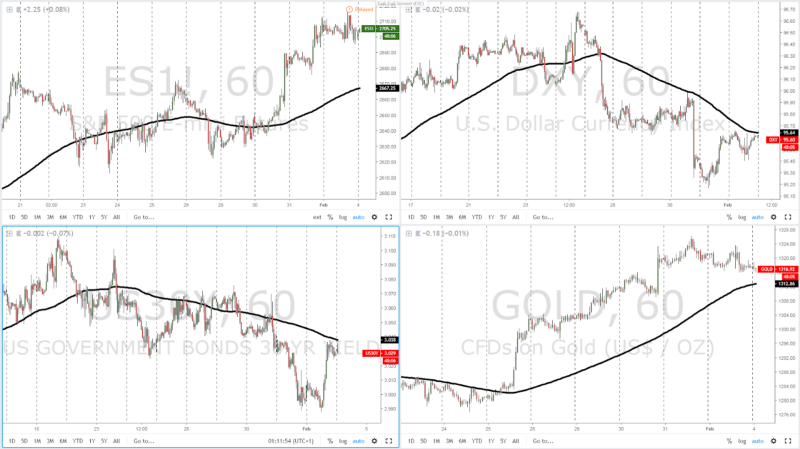
Source: Tradingview
U.S. equities could not find sufficient demand imbalances through Friday to keep the bull party going, even if it represents no change in trend dynamics. The vigorous recovery in the U.S.-30 year bond yield, jumping by over 5bp from 2.99% to now flirt with the 3.04% handle is a movement to pay attention to, as in the very short-term it communicates the outlook for the U.S. dollar may potentially improve, even if structurally there is more work to be done. Both the U.S.30Y and the DXY trade on down-cycles and a negative 5-DMA slope, so it’s going to take further upward pressure to turn more constructive. The same can be said when analyzing the valuation of gold, which is yet to show any technical cracks. Overall, we remain in a structurally USD negative environment with rising equities underpinning risk.
Source: Global PrimeYield Curve: Outlook For Growth, Inflation & Policies
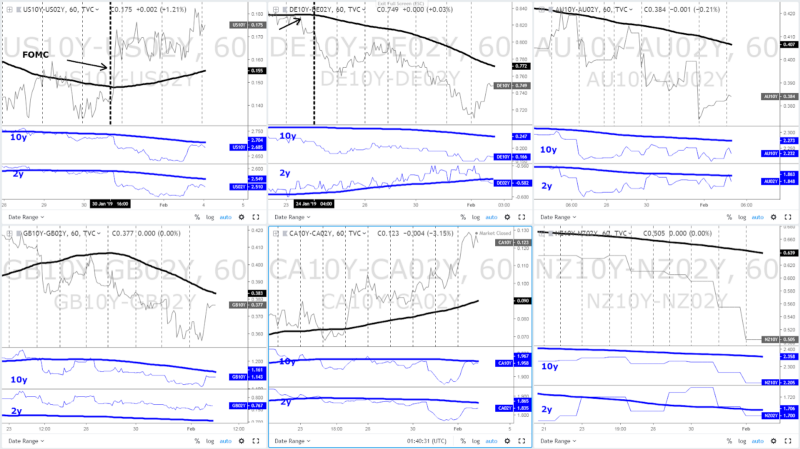
Source: Tradingview
In the last 24h, the dynamics in the U.S. yield curve have seen a sudden shift to a bear steepener as long-term 10y yields increase faster vs short-term yields, which at a micro level, communicates that the market has turned slightly more constructive on the economy and inflation, which theoretically translate in an environment constructive for a Central Bank raising rates. However, the dovish shadow the FOMC cast last week, from a macro standpoint, can’t be argued nor fought. That’s why such micro bear steepener outlook still has a gigantic steep hill to climb if it wants to challenge the newly established macro bull steepener phase the market is currently navigating, which is an environment where U.S. growth and inflation expectations decelerate.
In Australia, ahead of the busy Central Bank week, the yield curve has been sending us a clear message ever since the Jan 24th. The sudden drop in the NAB business conditions appears to have been the inflection point that resulted in the current bull flattening phase, as the market factors in the contagion of falling Australian housing prices spreading into the broader Australian economy. As the curve stands, even if the Wall Street Journal (WSJ) reported hawkish comments by the Reserve Bank of Australia (RBA) board member Ian Harper, noting the next move in rates is more likely to be up — purely a semantics cheap trick — it’s bond traders you want to listen to.
Find an eagle eye view of the Australian economy as of late:
In New Zealand, the last 24h of price action in the bond market have led to a re-anchoring of the micro + macro trend, as the bull flattening dynamics well established for quite some time re-align. If anyone argues for a potential rate hike by the RBNZ this year or early 2020, well, the message in the yield curve is plain opposite, with the market discounting a further slowdown in both the economy and the outlook for inflation, as the sharp drop, especially in the short-dated bond yield suggests.
With regards to the UK and Canada, the two countries were able to find enough supply in its fixed-income market to make yields more attractive, especially on the long-end, resulting in bear steepeners. In the case of the UK, the mild recovery in the micro trend still defies the macro bull flattening dynamics as the Brexit situation remains unclear at this stage. Out of all the macro yield curves analyzed, I must say that the Canadian fixed income market is the one holding up relatively well, so one may think opportunities to exploit this divergence against the weaker yield curves.
Notes:
Micro yield curve: It takes a look at the day-to-day rate of change in a country’s sovereign bond yield. This results in a short-term interpretation of the outlook of bond traders towards the Central Bank’s monetary policy bias going forward, based on the prospects of growth and inflation.
Macro yield curve: It takes a look at the 5-DMA slope and cycles in a country’s sovereign bond yield. This results in a mid-term interpretation about the outlook of bond traders towards the Central Bank’s monetary policy bias going forward, based on the prospects of growth and inflation.
*Bear Flattener: Short-term yields increase faster vs long-term yields (slower economic growth, relatively strong FX keeps CPI low, Central Bank in pause)
*Bear Steepener: Long-term yields increase faster vs short-term yields (economy in accelerating growth phase, Central Bank should raise rates)
*Bull Flattener: Long-term yields drop faster vs short-term yields(decelerating growth, low inflation, risk Central Bank lowers rates)
*Bull Steepener: Short-term yields drop faster vs long-term yields (decelerating economic growth, no inflation, Central Bank must cut rates)
Options — 25 Delta RR & Vols
* The 25-delta risk reversal is the result of calculating the vol of the 25 delta call and discount the vol of the 25 delta put. … A positive risk reversal (calls vol greater than puts) implies a ‘positively’ skewed distribution, in other words, an underperformance of longs via spot. The analysis of the 25-delta risk reversals, when combined with different time measures of implied volatility, allows us to factor in more clues about a potential direction. If the day to day pricing of calls — puts increases while there is an anticipation of greater vol, it tends to be a bullish signal to expect higher spot prices.
Source: http://cmegroup.quikstrike.net (The RR settles are ready ~1am UK).
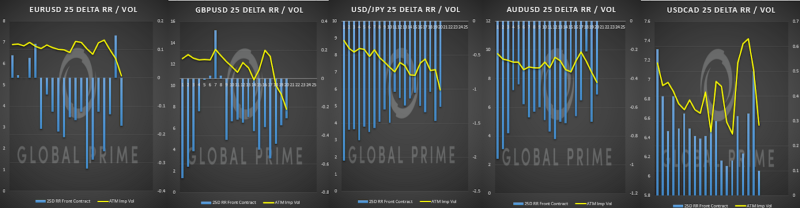
Chart Insights: Technicals & Intermarket Analysis
EUR/USD: Unclear Bias Short-Term
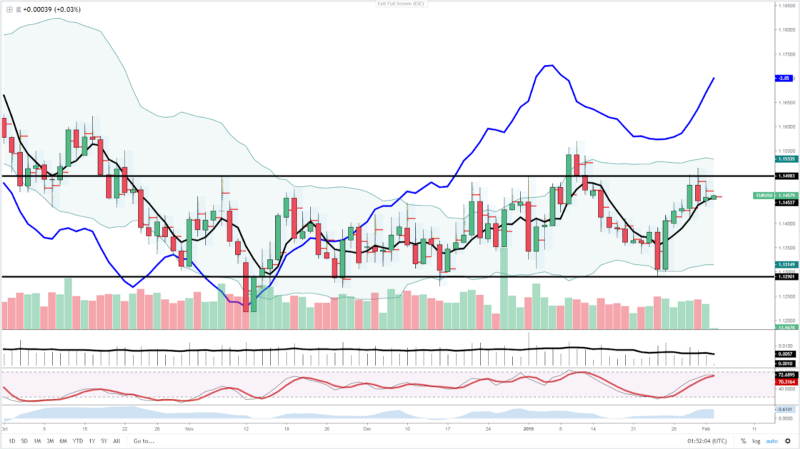
The momentum in the pair has been clearly waning as the price action clearly reflects, with back-to-back long-topside tails. The U.S. economy, unlike the EU, is not yet showing signs of major cracks in its economic momentum, even if the macro view of a decelerating U.S. economy and contained inflation is narrative gaining traction. The increase in Put premiums is a bad augur short-term, with options traders’ vol skewed now favoring a shift in what still can be argued to be a bullish momentum trade if one judges the 5-DMA slope. To further complicate the potential bias, the German vs U.S. yield spread keeps diverging, which suggests capital flows in favor of the Euro. Overall, a pair exhibiting no clear clues to take either side from a daily perspective.
USD/JPY: Disconnect Price Action & Correlations
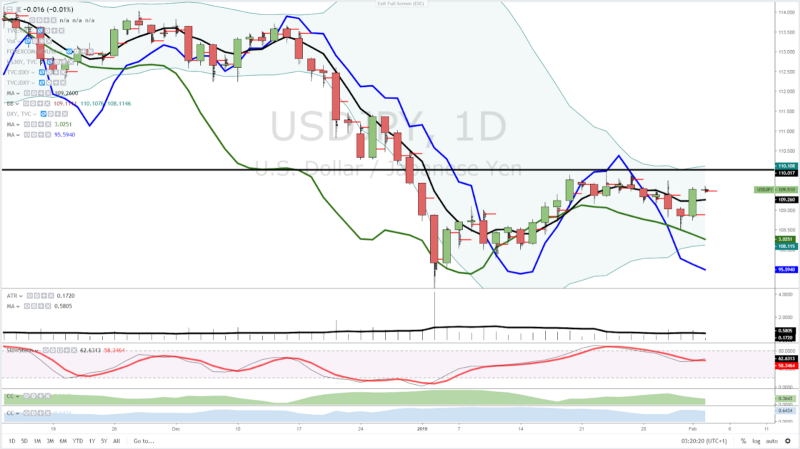
There is no doubt that the price action has transitioned into a phase of bullish momentum, but unless there is a major shocker, any retest of the 110.00 macro resistance should be met with grateful seller. Why am I saying this? Quite simply, because price action is currently front-running other correlated instruments such as the U.S. 30-year bond yield and the DXY, both still exhibiting downward slopes that would suggest the current correction in price action should remain corrective and limited in nature. The strong close by NY, however, is still indicative that residual momentum-led demand could see us testing the 110.00, which means room for an additional 50p pop is definitely within reach.
AUD/USD: Technically Bullish, RBA Risk Ahead
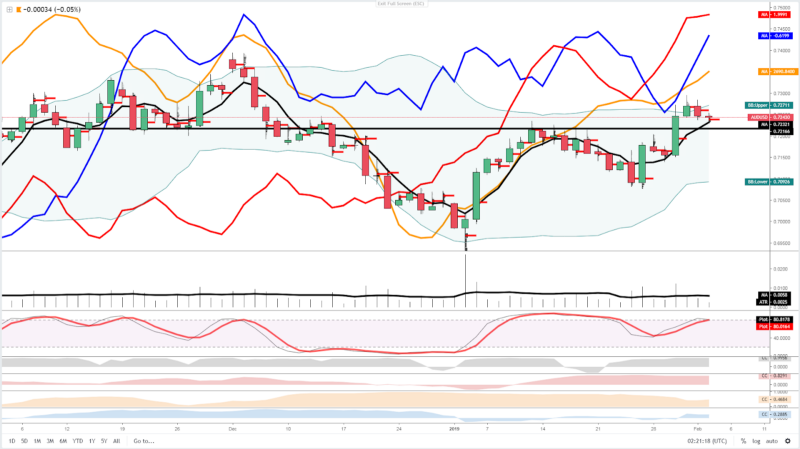
If this was not the rich fundamental-driven week it’s going to be, I’d say the technical and Intermarket studies keep screaming to buy the Aussie on dips. But such a strategy would find one relatively soon in a fairly dangerous position as the RBA monetary policy outcome represents an immediate downside risk for the Australian dollar. By now, the Central Bank should have collected sufficient evidence to tone down the outlook for the economy, a view being expressed by the yield curve as shown above. Technically, the Aussie still finds itself in a newly established up-cycle, while the slope in the 5-DMA of the DXY, Yuan, equities and even the Aussie vs U.S. yield spread all benefit the pair. The alignment of all these factors should guarantee solid flows during Monday ahead of the reset play.
NZD/USD: Testing Resistance, Bullish Flows Remain
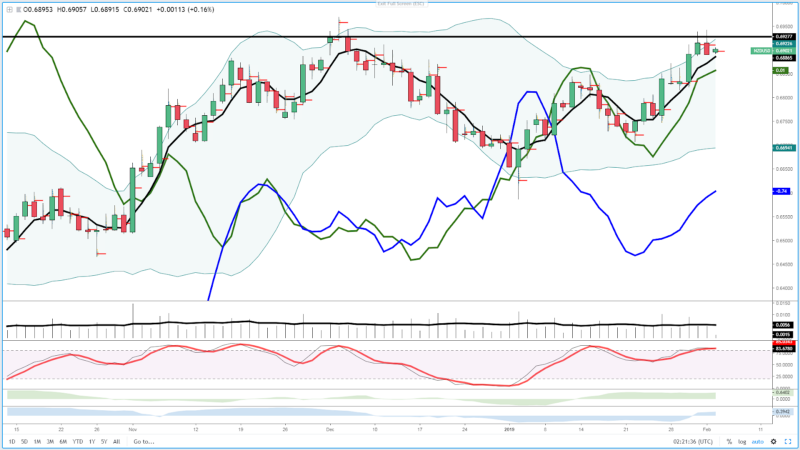
Be on high alert if you are entering a short position on the Kiwi as correlations are far from suggesting that the bearish turnaround may find further legs down. As the chart above exhibits, the bullish momentum won’t just stop on its tracks amid concurrent upward slopes in the NZ vs U.S. yield spread alongside the inverted DXY, indicative of a macro USD bearish environment. The rejection of a key resistance above 0.69 is definitely an area worth trying shorts, but the intermarket backdrop makes this trade still a fairly risky proposition until further evidence of technical cracks gathered.
Important Footnotes
- Risk model: The fact that financial markets have become so intertwined and dynamic makes it essential to stay constantly in tune with market conditions and adapt to new environments. This prop model will assist you to gauge the context that you are trading so that you can significantly reduce the downside risks. To understand the principles applied in the assessment of this model, refer to the tutorial How to Unpack Risk Sentiment Profiles
- Cycles: Markets evolve in cycles followed by a period of distribution and/or accumulation. The weekly cycles are highlighted in red, blue refers to the daily, while the black lines represent the hourly cycles. To understand the principles applied in the assessment of cycles, refer to the tutorial How To Read Market Structures In Forex
- POC: It refers to the point of control. It represents the areas of most interest by trading volume and should act as walls of bids/offers that may result in price reversals. The volume profile analysis tracks trading activity over a specified time period at specified price levels. The study reveals the constant evolution of the market auction process. If you wish to find out more about the importance of the POC, refer to the tutorial How to Read Volume Profile Structures
- Tick Volume: Price updates activity provides great insights into the actual buy or sell-side commitment to be engaged into a specific directional movement. Studies validate that price updates (tick volume) are highly correlated to actual traded volume, with the correlation being very high, when looking at hourly data. If you wish to find out more about the importance tick volume, refer to the tutorial on Why Is Tick Volume Important To Monitor?
- Horizontal Support/Resistance: Unlike levels of dynamic support or resistance or more subjective measurements such as Fibonacci retracements, pivot points, trendlines, or other forms of reactive areas, the horizontal lines of support and resistance are universal concepts used by the majority of market participants. It, therefore, makes the areas the most widely followed and relevant to monitor. The Ultimate Guide To Identify Areas Of High Interest In Any Market
- Trendlines: Besides the horizontal lines, trendlines are helpful as a visual representation of the trend. The trendlines are drawn respecting a series of rules that determine the validation of a new cycle being created. Therefore, these trendline drawn in the chart hinge to a certain interpretation of market structures.
- Correlations: Each forex pair has a series of highly correlated assets to assess valuations. This type of study is called inter-market analysis and it involves scoping out anomalies in the ever-evolving global interconnectivity between equities, bonds, currencies, and commodities. If you would like to understand more about this concept, refer to the tutorial How Divergence In Correlated Assets Can Help You Add An Edge.
- Fundamentals: It’s important to highlight that the daily market outlook provided in this report is subject to the impact of the fundamental news. Any unexpected news may cause the price to behave erratically in the short term.
- Projection Targets: The usefulness of the 100% projection resides in the symmetry and harmonic relationships of market cycles. By drawing a 100% projection, you can anticipate the area in the chart where some type of pause and potential reversals in price is likely to occur, due to 1. The side in control of the cycle takes profits 2. Counter-trend positions are added by contrarian players 3. These are price points where limit orders are set by market-makers. You can find out more by reading the tutorial on The Magical 100% Fibonacci Projection