Green Days And Green Weeks Common During Downtrends
If we were having dinner with a friend while the markets were closed, it would be easy to say, “yeah that makes sense” in response to the following statement:
During a bullish trend, stocks do not go up every day. During a bearish trend, stocks do not go down every day.
However, when the markets are open and a counter-trend rally comes, it is very difficult to remember the common sense statements above, since emotions and egos like to take over.
What Can We Learn From History?
The table below shows the largest 40 daily gains in the S&P 500 during the dot-com bear market. It tells us big up days are very, very common within the context of an established downtrend.
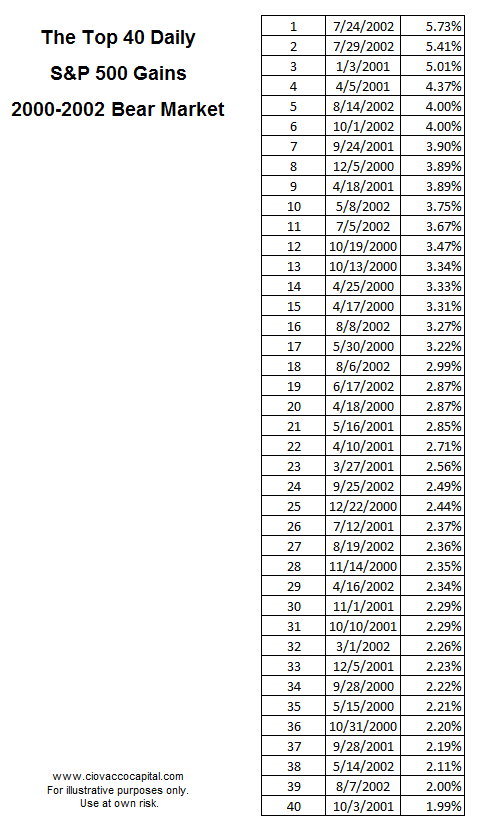
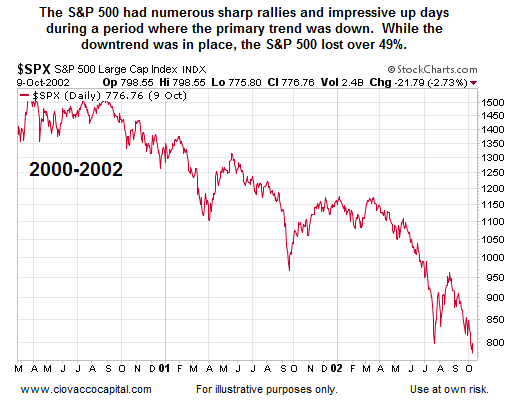
Given the magnitude and frequency of the gains in the table above, you may find it difficult to believe that during the same period the S&P 500 lost 49% (see chart below).
How Do The Trends Look In 2016?
The charts shown in this week’s video, below, help us better understand the context of recent green days in the stock market. The charts speak for themselves:
How About The Financial Crisis?
The results paint a very similar picture. It was not easy to navigate the 2007-2009 bear market in terms of holding defensive assets during the big up days and counter-trend moves. Markets never make anything easy on anyone (bulls or bears).
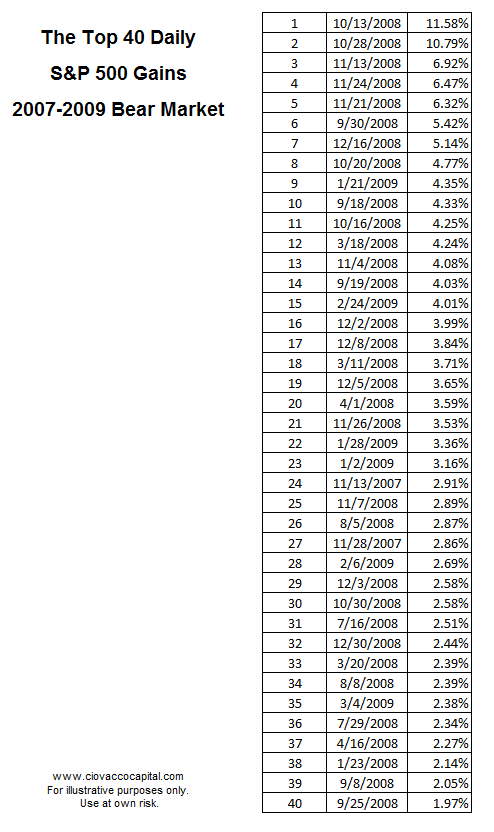
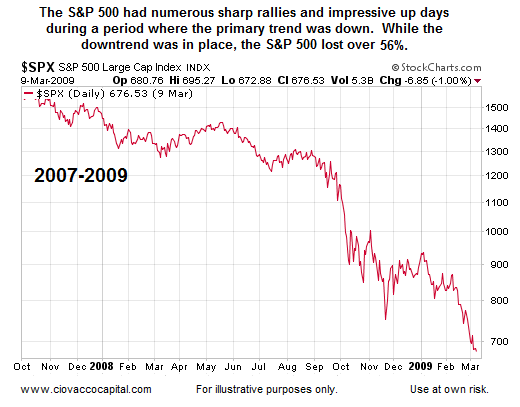
During both bear markets, the primary trend drove the outcome, rather than the counter-trend green days shown above. Despite the top 40 daily green days, the S&P 500 lost over 56% between October 2007 and March 2009 (see chart below).
It Is Not Just One-Day Wonders Either
If you want to be right during a downtrend, you are going to have to be willing to be wrong on about 50% of the days during that downtrend. What can we learn from a green day during a downtrend?
- The 2007-2009 bear market lasted 355 trading days. You might guess that the vast majority of those days stocks were red. That was not the case.
- During the 355 trading-day bear market, 180 were red or down days; 175 were green or up days.
In our case, and based on our time-frame, it is very important that we do not waste a lot of mental energy on greens vs. red days, but rather we must focus on the primary trend. There are numerous green days during a downtrend, just as there are numerous red days during an uptrend, which is what makes investing so difficult.
Stats Are Easy To Forget When Your Positions Are Red For The Day
The facts show that is it very common for defensive assets to have red days during a downtrend. The hard part is remembering that when the market is open and your screen is red. Bull markets are not easy. Bear markets are not easy. The market model is designed to keep us aligned with the primary trend, and even that is not easy since there are primary trends on daily, weekly, and monthly time-frames; something that the model accounts for, but that topic is beyond the scope of this article.
Moral Of The Story
Do you think defensive assets performed well during the top 40 green days (2000-2002) and the top 40 green days (2007-2009)? Of course not. In fact, during those 80 days, defensive assets under-performed significantly relative to the stock market.
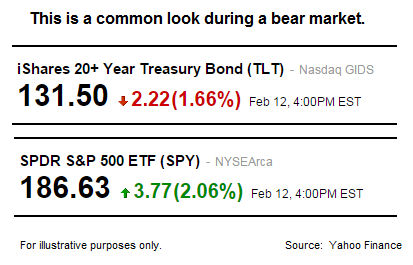
Do you think defensive assets beat the stock market during the entire dot-com bust bear market and financial crisis bear market? Yes, they killed the S&P 500, but in order to capture those gains, you had to remain disciplined during the numerous green days that attempted to bait us into common human mistakes that are made over and over again in bear markets.
Using Hard Evidence, Rather Than Emotions, As A Guide
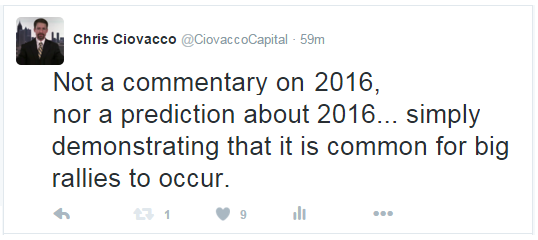
Under our approach, if we remain disciplined and follow the rules (and that includes staying with the approach during normal counter-trend moves), the hard evidence will keep us aligned with the primary trend. The same evidence and rules will alert us to a probable change in trend. The tweet below captures the purpose of this post.
Flexibility Key In All Markets
Ugly charts and ugly market profiles can begin to show meaningful improvement at any time. Therefore, we will head into this coming week open to all longer-term outcomes from max bull to max bear.
