- U.S. economy has stayed resilient despite looming recession fears and rate hikes
- Meanwhile, the S&P 500 has retained its long-term bullish trend despite occasional setbacks like the recent retracement
- The stock market, historically, consistently yields gains in the long term, and indications don't point to an imminent market meltdown
In the face of looming recession fears and persistently dire predictions, the U.S. economy has managed to demonstrate remarkable resilience.
With an annual GDP growth of 4.9% in the third quarter, even amid one of the most aggressive rate hike cycles in decades, the economic outlook contradicts the gloomy forecasts that had previously unnerved investors.
This begs for a closer examination of stock market returns over the past decade to gain a more balanced perspective on the prevailing situation.
S&P 500: Long-Term Bullish Trend Has Stayed Intact
Over the past decade, the S&P 500 has exhibited remarkable growth, surging by more than 200% at an average annual rate exceeding 10%. However, this journey hasn't been without its share of setbacks.
The global pandemic triggered a swift 34% decline in just over a month, and we witnessed another 25% dip last year due to the inflationary climate.
Additionally, in recent months, the market has experienced a roughly 10% retracement from the highs of July.
While it's true that the market is prone to sharp declines at various points, which is statistically normal, the overall trajectory remains upward.
Stocks tend to consistently yield significant gains in the long term. To achieve long-term investing success, it's crucial not to be swayed by perpetual predictions of impending crashes.
More often than not, such forecasts position us on the wrong side of the market trend. If we examine the data since 1950, bear markets have accounted for approximately 17% of the time.
On average, U.S. indexes experienced a 10% decline from all-time highs. Year-to-year returns have surpassed 10% more than half of the time.
Over a decade, the stock market has risen about 97% of the time, and year-to-year, it has climbed 75% of the time. 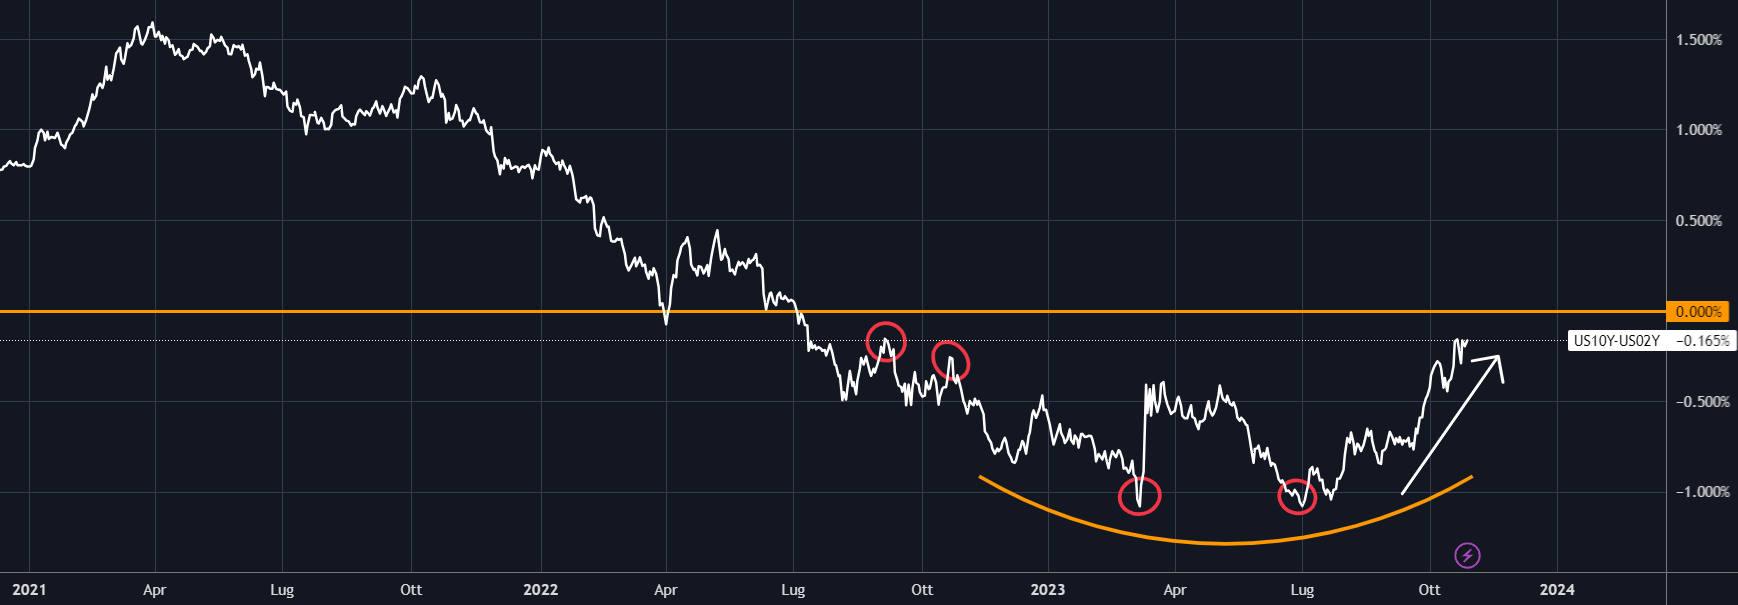
In addition, the inverted yield curve that brought panic to the markets, heralding an economic recession for over a year, has in recent weeks reached new annual highs making its way back toward the parity level, flattening out.
Is the market environment changing?

Inflation expectations, as gauged by the ratio of TIPs (inflation-adjusted bonds) to IEFs (U.S. government bonds), are on the rise, akin to the patterns observed during the initial Fed rate hike in 2022.
Furthermore, in line with these developments, the iShares Russell 2000 Value ETF (NYSE:IWN) compared to the S&P 500 appears to be mirroring the trends observed in the previous year. 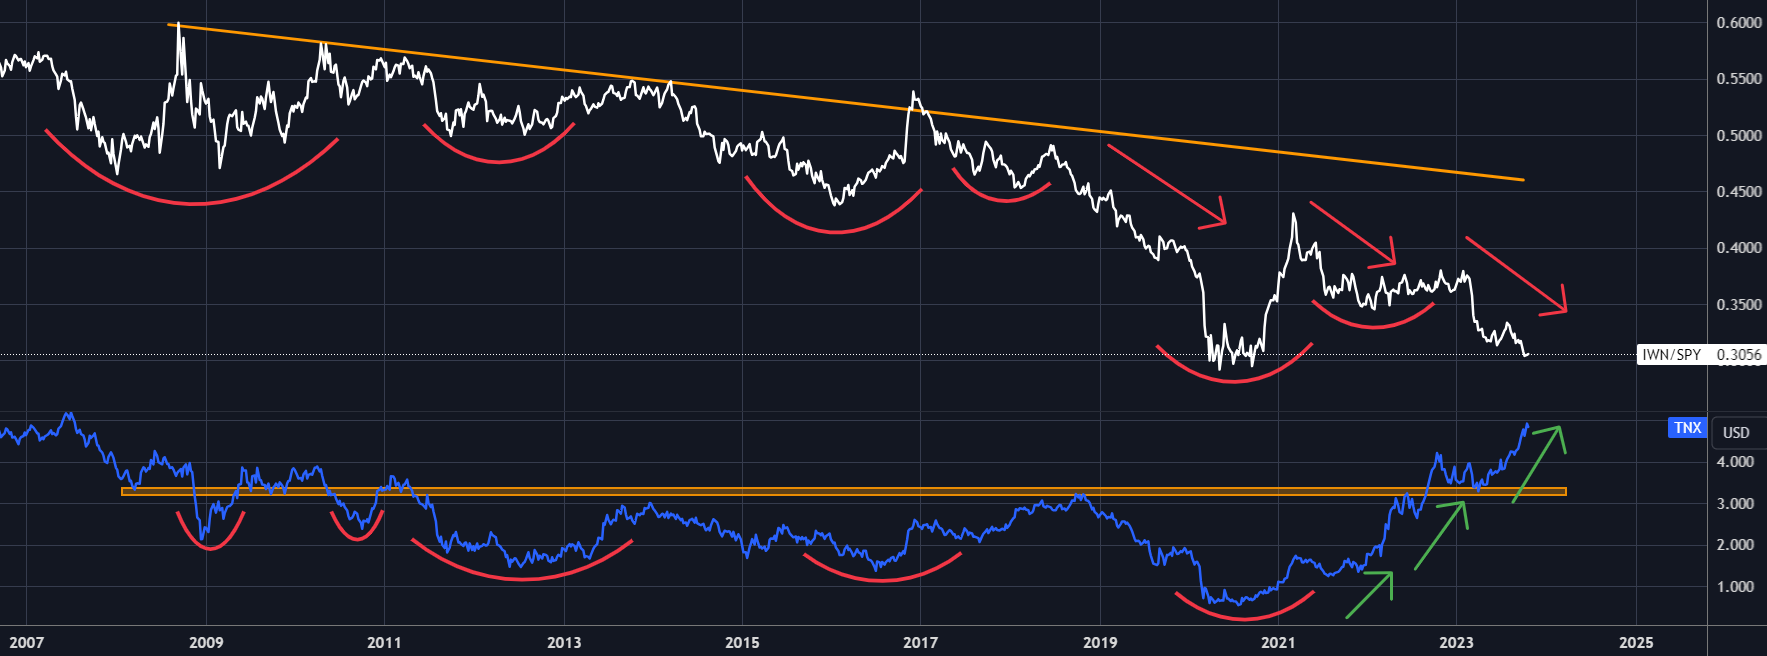
The ratio has significantly favored the S&P 500, and this trend shift began around March 2021. This change in market dynamics is noteworthy, as it is retesting the lows of 2020 while the 10-Year yields are approaching the 5% mark.
Typically, rising interest rates tend to benefit the Russell 2000, especially favoring value stocks. However, the current situation does not align with this historical pattern.
These companies are profoundly influenced by economic trends, and this bearish trend may potentially serve as an early indicator of a challenging start to 2024.
Conversely, when we examine the ratio of Value to small-cap Growth, historical trends reveal that Values tend to outperform Growths during periods of rising 10-year U.S. yields. It appears that this trend is resurfacing once again. 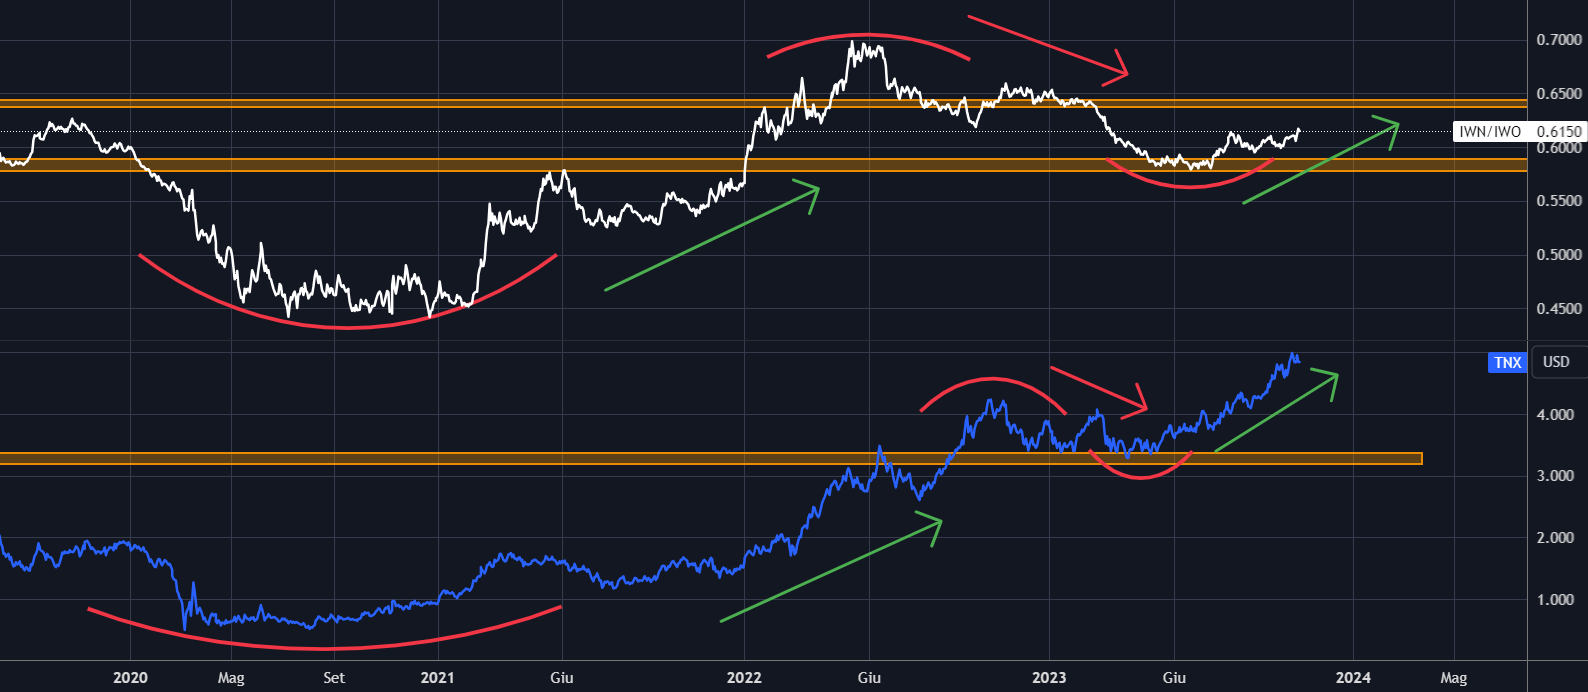
Is a Stock Market Meltdown Imminent?
Around three months have passed since the onset of the stock market correction. Currently, the indicators appear to be mixed but do not point to an imminent market meltdown.
While some may be convinced that this correction is only the initial phase of a more significant downturn, I still perceive it as a seasonal correction.
My focus remains on the catalyst that could potentially usher in a bullish trend: A weakening dollar.
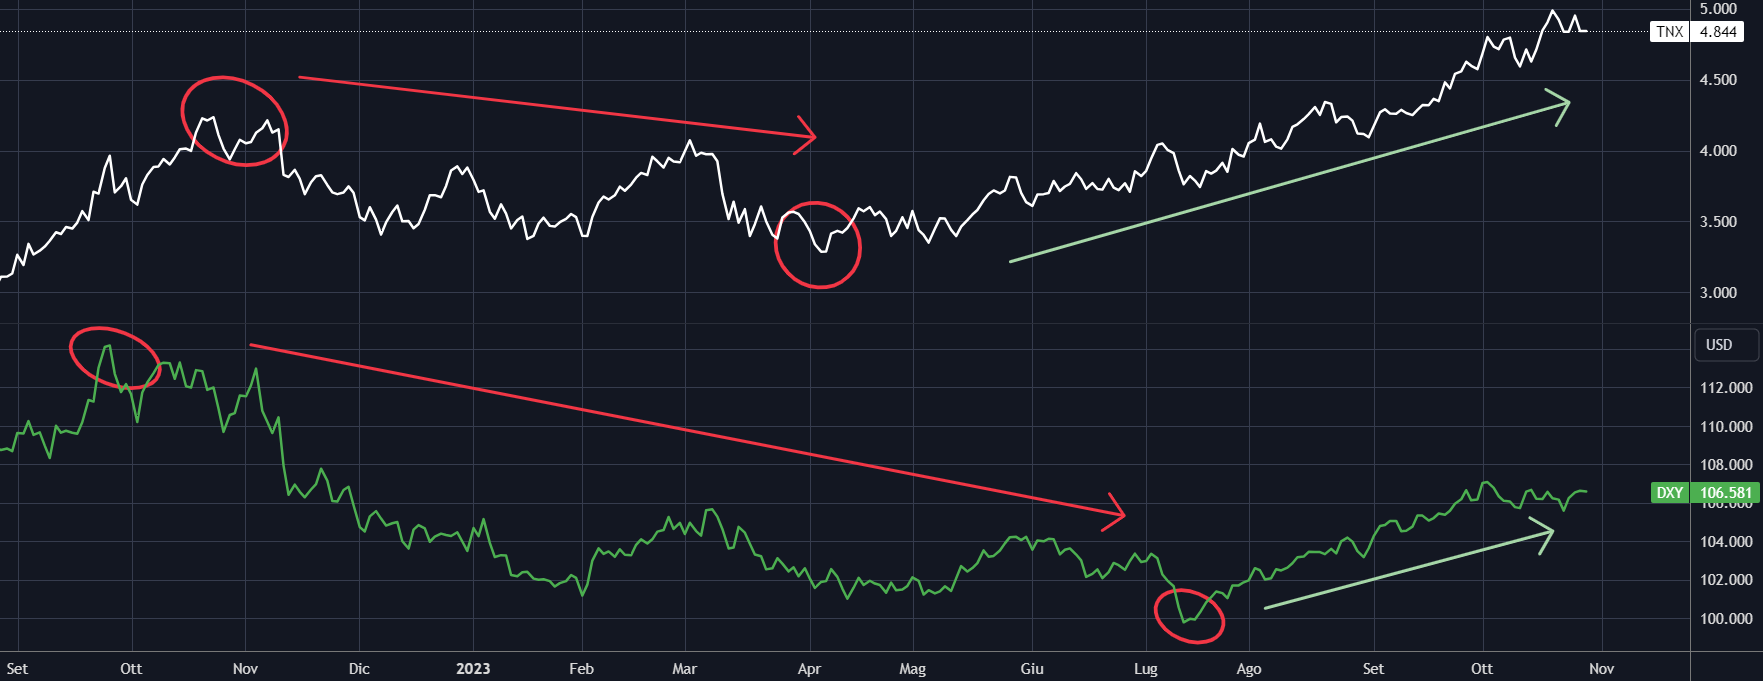
The 10-year U.S. yield we have shown has reached new highs and the U.S. dollar is following it, staying above the $105 level. This isn't good for equities.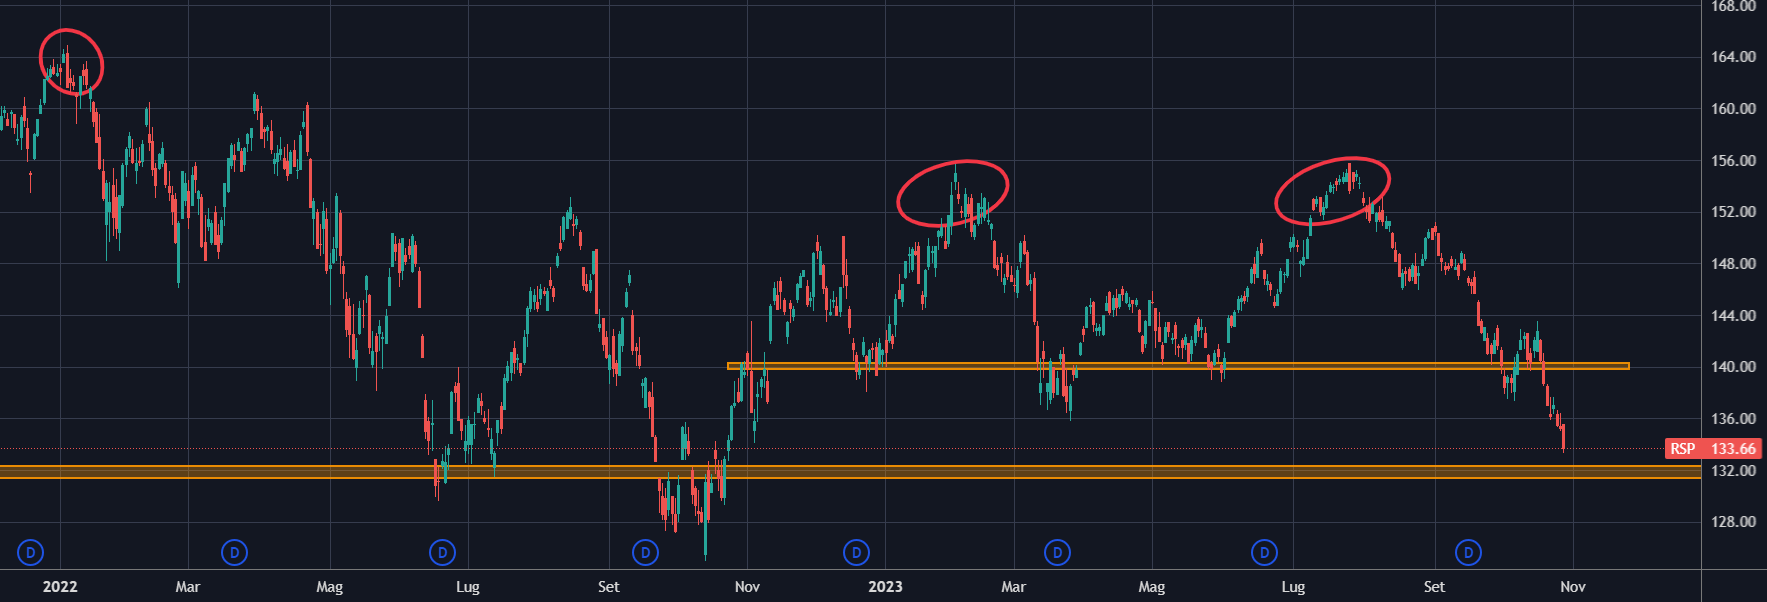
Examining the S&P 500 Equal Weight ETF (NYSE:RSP), it has demonstrated negative performance since the last all-time high in January 2022, registering a decline of approximately 18%.
Year-to-date, it has declined by 5%, and from its peak in July 2023 to the present, it has experienced a drop of over 14%.
Furthermore, it has breached the Fibonacci 0.618% retracement level, thereby confirming a bearish trend with the potential to extend downward below the $130 threshold.
***
Disclaimer: This article is written for informational purposes only; it does not constitute a solicitation, offer, advice, or recommendation to invest as such it is not intended to incentivize the purchase of assets in any way. I would like to remind you that any type of asset, is evaluated from multiple points of view and is highly risky and therefore, any investment decision and the associated risk remains with the investor.

