“The key strategic decision for anyone shaping investment strategy is whether to apply aggressiveness or defensiveness at a given point in time.” Howard Marks said that. And when one of the world’s most successful investors speaks out, I listen.
Mr. Marks, who has a personal net worth of $2 billion and who co-founded Oaktree Capital Management, practices a form of tactical asset allocation. He surveys the investment environment to determine if he should concern himself more with missed opportunity or losing money. And right now, he is far more troubled by the latter possibility.
In his Oaktree memo last week, Mr. Marks noted that future returns for the overwhelming majority of asset types have rarely been lower in history. Moreover, he rejects the notion that one should pursue investments that are less ridiculously priced than others.
Here are three primary reasons why Mr. Marks believes that now is a time to place a greater emphasis on being defensive:
(1) Plenty of liquidity, few good investment ideas. Central banks have created an oversupply of capital. Inevitably, the oversupply of money filters into nearly every cranny and nook of the investment universe, no matter how poor the prospects going forward may be.
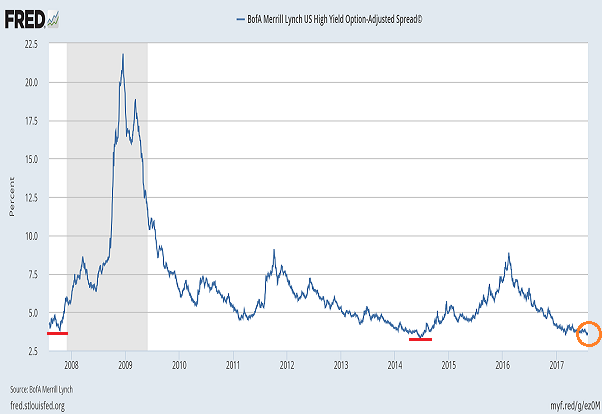
For example, the spread between high yield junk bonds and the risk-free rate of comparable treasuries has rarely been this low. When investors reach for so little additional yield over the risk-free rate of return, particularly in poorly-rated credit, it tends to be an indication of speculative aggressiveness gone awry.
Prior to the previous bear market’s inception (10/07) and the financial crisis of 2008, the BofA Merrill Lynch US High Yield Option-Adjusted Spread © had compressed to 3.90. It is lower today at 3.60. This junk bond barometer spread also hit a lower level in 2014 (3.35%). Shortly thereafter, junk bonds experienced a painful beating due to oil company distress.
(2) Rejection of time-tested valuation measures. Investor response to valuation extremes in the 98%-100% percentile (e.g., price-to-book, price-to-sales, EV-to-sales, price-to-earnings, return on equity, market-cap-to-GDP, PEG ratio, EV-to-EBITDA, dividend yield, Tobin’s Q, etc.) typically focuses on “never-before-seen” interest rate lows. Unfortunately, response providers demonstrate a poor understanding of history.
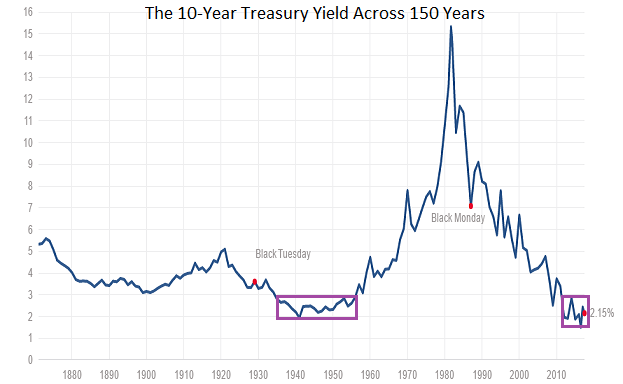
The U.S. experienced 20 years of bond yields in and around the same place as they are today (1935-1954). Importantly, low rates around 2%-2.5% did not terminate bear market price evisceration in those two decades. Four bear markets occurred with losses of -49.1%, -23.3%, -40.4%, and -23.2% respectively. Equally worthy of note, the very same valuation measures during the bullish peaks in the 20-year period never approached the mindless extremes that exist at present.
(3) This time is different. Marks posits that when an investor pursues gain at the expense of prudence, he/she foolishly concludes that the present stock market is unique, if not unidirectional. However, the investment community made the same erroneous assumptions about the permanence of the “Nifty Fifty” in the 1960s, oil corporations in the 1970s, computer hardware companies in the 1980s, as well as dot-com start-ups in the 1990s.
Marks explained that buying into a concept regardless of price is the “…absolute hallmark of a bubble.” The acronym ‘FANG’ is a perfect example of what he means. When key components like Amazon (NASDAQ:AMZN) and Netflix (NASDAQ:NFLX) trade at P/Es of of 250 and 220 respectively – when colorful commentators tell you that FANG companies must be valued differently from all other types of companies – the flawed thinking of why ‘this time is different’ comes to light.
Price actually does matter. The higher the price one pays, the lower the prospective return going forward. Similarly, low rates alone to do not justify exorbitant valuations in the 99th percentile.
Consider S&P 500 forward earnings projections for year-end 2017 at the start of 2016. According to S&P data, they have fallen from $121.09 (GAAP) down to $116.57 (GAAP). That’s -3.7%. In contrast, S&P 500 stock prices have already catapulted 10.4% in the first seven months, pushing valuations toward record heights.
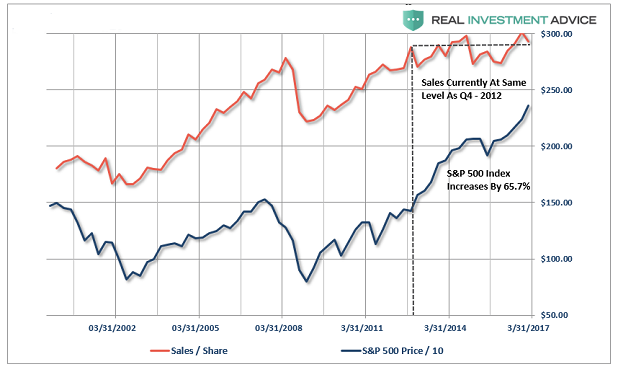
It does not get much better when you examine sales. According to Lance Roberts of Real Investment Advice, , stock prices have leap-frogged roughly 66% while sales-per-stock-share have barely budged since Q4 of 2012. That has pushed price-to-sales for the S&P 500 to dot-com mania era valuations (March 2000).
“Yeah, Gary. But there’s still no recession coming anytime soon,” you protest. That may or may not be the case. Yet a recession is not a pre-cursor for bearish price depreciation. Approximately 40% of all bear markets in history have been non-recessionary. Since 1950, we have seen non-recession 20%-plus drops in 1962, 1966, 1978 and 1987. We have even seen non-recession drops that did not get the full benefit of the bear title (e.g., 1998’s Asian currency crisis/Long Term Capital Management, 2011’s euro-zone, etc.), yet reached the 20% threshold via “intra-day” price movement.
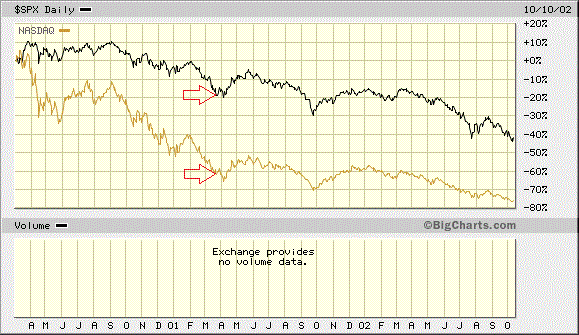
There’s more. Some bear markets receive the recession tag, even though the recession began 12 months after the bear began mauling. Look no further than the 3/2000-10/2002 tech wreck. Since the recession began one full year later in March of 2001, should investors really be hanging onto the notion that a 2018 recession does not appear to be materializing at this moment?
Referencing low interest rates and/or low recession probability is shortsighted, particularly when investors are eight-and-a-half years into the bull-bear cycle. What is more mindful? Understanding that central bank liquidity is the reason that the market shrugs off almost everything is critical.
Corporate profitability trends are not as favorable as the media want you to believe. Sales have been downright anemic. Weakening job growth, lackluster GDP and retailer woes are not signs that things are on the mend. Extraordinary leverage via debt ratios is evident at the household, corporate and government level. There’s political indigestion on the domestic front. Geopolitical strife is resulting in war games with North Korea. Stocks and riskier assets are not merely climbing the proverbial Wall of Worry; rather, at this moment in time, the ultra-accommodating monetary policy of global central banks is an unchallenged source for asset price inflation.
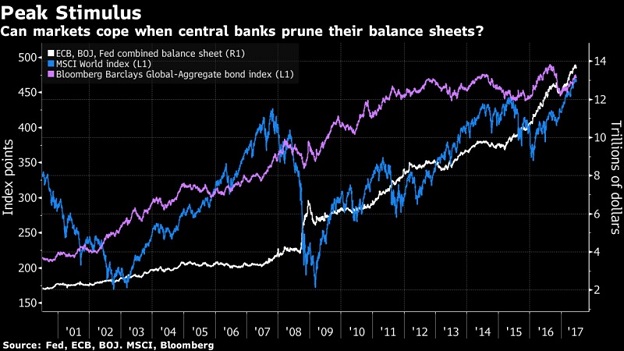
So here’s the rub. Not only is the Federal Reserve openly discussing the reduction of its balance sheet, European Central Bank President Draghi and Bank of England Governor Carney are also discussing how to end Europe’s version of quantitative easing (QE). Granted, stimulus would not come to a grinding halt. Nevertheless, a stimulus slowdown would be bumping up against alarming valuations as well as economic vulnerability.
For most of my retiree and near-retiree clients, I maintain three tactical asset allocation possibilities. One might characterize them as: (1) bullish, (2) defensive, or (3) bearish. Since the beginning of 2015, we have maintained our defensive posture.
When both fundamentals and technicals are reasonably attractive, we allocate 70% to widely diversified equity and 30% to widely diversified income. When fundamentals alone are favorable, or when technicals alone are encouraging, we have a defensive allocation consisting of 50% higher quality stock, 25% higher quality income and 25% cash/cash equivalents. Supportive technicals like the S&P 500’s 10-month simple moving average as well as the NYSE Advance/Decline (A/D) Line provide the impetus for remaining 50% allocated to overvalued stocks. (Note: During the last 12 months, we have shifted a portion of S&P 500 assets to all-world index tracking investments.)
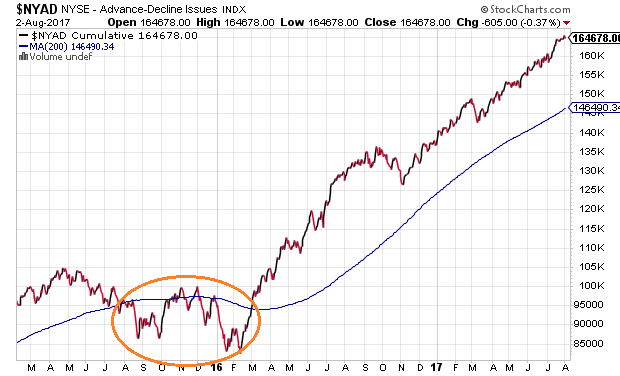
If the supportive technical backdrop breaks down such that the NYSE A/D Line as well as the 10-month simple moving average both capitulate, I would shift to a bearish allocation for greater protection. That would constitute 30%-33% highest quality equity, 20%-22% investment grade income and 45%-50% cash. It is the same allocation that helped me protect a whole lot of capital in the tech wreck (2000-2002) as well as the financial crisis (2008-2009).
Perhaps ironically, a comment provider recently asked what it would take for me to move from a defensive allocation to a bullish one. My answer? Favorable valuations where earnings, revenue, book value, GDP grow at a significantly faster pace than stock prices. That’s not very likely in the current cycle.
The most probable outcome going forward? Technicals eventually break down and prices fall significantly to make those valuations attractive again. In other words, I would anticipate a tactical shift from a defensive allocation to a bearish allocation.
That said, such a shift would be beneficial for long-term rewards. Amiable stock valuations could serve up phenomenal 7-10 year return prospects.
Keep in mind, one should not make a bearish allocation shift to a bullish allocation on enticing valuations alone, anymore than one should make a bullish allocation shift to a bearish allocation shift on extreme overvaluation alone. It follows that I would wait for the same technical signals (i.e., NYSE A/D Line, S&P 500 10-month MA) to confirm the start of a new bull market.
Disclosure Statement: ETF Expert is a web log (“blog”) that makes the world of ETFs easier to understand. Gary Gordon, MS, CFP is the president of Pacific Park Financial, Inc., a Registered Investment Adviser with the SEC. Gary Gordon, Pacific Park Financial, Inc., and/or its clients may hold positions in the ETFs, mutual funds, and/or any investment asset mentioned above. The commentary does not constitute individualized investment advice. The opinions offered herein are not personalized recommendations to buy, sell or hold securities. At times, issuers of exchange-traded products compensate Pacific Park Financial, Inc. or its subsidiaries for advertising at the ETF Expert website. ETF Expert content is created independently of any advertising relationship.
