
- Investors in the withdrawal stage of their financial lives are well served to select investments with an eye toward above average risk adjusted returns to minimize the risk of outliving their assets
- Higher risk adjusted returns are not always the highest returns, but they can be the least emotionally or financially dangerous returns
- Over the past 10 years, very few non-US funds have achieved better risk adjusted returns than the S&P 500
- Healthcare funds have dominated the best risk adjusted returns, along with large-cap funds
- 5 large-cap growth ETFs
- 5 healthcare ETFs
- 3 consumer cyclical ETFs
- 2 consume defensive ETFs
- 1 large-cap value ETF
- 1 mid-cap growth ETF
- retail availability at Schwab or Fidelity or Vanguard
- total assets of at least $100 million
- minimum initial purchase not more than $100,000
- not closed to new investments or new investors
- no front or back loads (other than short-term redemption penalty or transaction fee)
- average or better Morningstar overall rating
- average or higher 3-year and 5-year Morningstar return rating
- average or lower 3-year and 5-year Morningstar risk rating
- downside capture ratio for 3-years and 5-years less than 100
- 6 healthcare funds
- 3 US large-cap blend funds
- 3 US mid-cap growth funds
- 2 US large-cap growth funds
- 2 consumer cyclical funds
- 1 consumer defensive fund
- 1 US mid-cap value fund
Investors in the withdrawal stage of their financial lives may prefer a smooth ride with a good return more than a very bumpy ride with a better than good return.
That is because volatility during withdrawals can deplete the assets of the portfolio dangerously, increasing the “risk of ruin” (outliving assets).
Fixed dollar regular periodic accumulation improves return, and regular periodic fixed dollar withdrawal has the opposite effect.
It is volatility that makes regular fixed dollar periodic accumulation beneficial, and it is volatility that makes regular periodic fixed dollar withdrawal harmful.
With those ideas in mind, we looked for ETFs and mutual funds (collectively “funds”) that had better volatility risk to total return ratios than the S&P 500. Because upside volatility is beneficial and not harmful to a portfolio during withdrawals, we chose to use the Sortino Ratio instead of the Sharpe Ratio.
The Sortino Ratio is like the Sharpe Ratio (total return in excess of risk-free rate over the standard deviation of return), but only considers downside volatility.
We looked for funds that had a higher Sortino Ratio for 3 years, 5 years, and 10 years, and that also had a total return at least 90% of the return of the S&P 500 (as represented by ARCA:SPY for ETFs and by VFINX for mutual funds) for each of 3, 5 and 10 years, as well as 1 year, with at least a positive return YTD.
We chose to require a 10-year history to include the build up to and the experience of the 2008-2009 stock market crash.
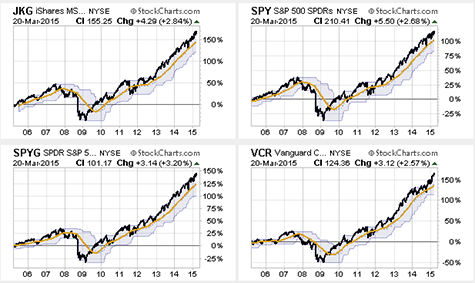
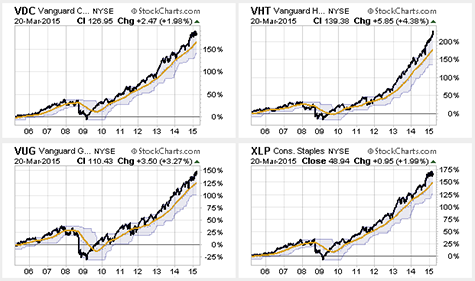
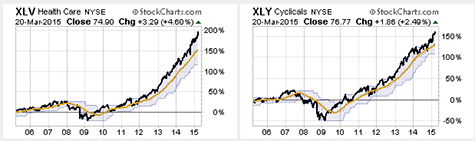
For ETFs, we looked at the 500 largest by assets. Only 17 passed the filter:
| iShares US Consumer Services | IYC |
| Vanguard Consumer Discretionary ETF | VCR |
| Consumer Discret Sel Sect SPDR® ETF | XLY |
| Vanguard Consumer Staples ETF | VDC |
| Consumer Staples Select Sector SPDR® ETF | XLP |
| iShares Nasdaq Biotechnology | IBB |
| iShares Global Healthcare | IXJ |
| iShares US Healthcare | IYH |
| Vanguard Health Care ETF | VHT |
| Health Care Select Sector SPDR® ETF | XLV |
| iShares S&P 500 Growth | IVW |
| iShares Russell 1000 Growth | IWF |
| iShares Morningstar Large-Cap Growth | JKE |
| SPDR® S&P 500 Growth ETF | SPYG |
| Vanguard Growth ETF | VUG |
| First Trust Value Line® Dividend ETF | FVD |
| iShares Morningstar Mid-Cap | JKG |
The ETF list is dominated by large-cap growth and healthcare:
This table shows the relative risk adjusted level for the ETFs as well as their Sortino Ratios and rolling returns.

This table shows the relative risk adjusted level, plus the calendar year returns for 10 years.

For mutual funds, because there are over 8,000 mutual fund portfolios with over 27,000 share classes, we wanted to reduce the universe to inspect. Therefore we filtered for several additional criteria, including:
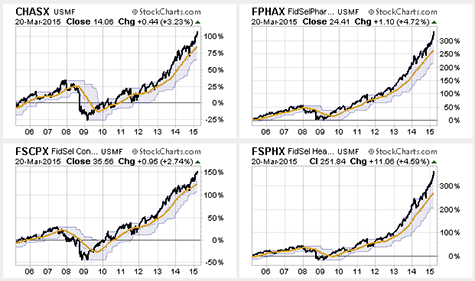
Only 18 mutual funds passed that filer:
| Fidelity® Select Consumer Discret Port | FSCPX |
| Vanguard Consumer Discretionary Idx Adm | VCDAX |
| Vanguard Consumer Staples Index Adm | VCSAX |
| Fidelity® Select Pharmaceuticals Port | FPHAX |
| Fidelity® Select Health Care Portfolio | FSPHX |
| BlackRock Health Sciences Opps Svc | SHISX |
| Schwab Health Care | SWHFX |
| Vanguard Health Care Adm | VGHAX |
| Vanguard Health Care Index Adm | VHCIX |
| PRIMECAP Odyssey Stock | POSKX |
| Parnassus Core Equity Institutional | PRILX |
| Vanguard Dividend Growth Inv | VDIGX |
| Chase Growth N | CHASX |
| INTECH US Core T | JRMSX |
| Hennessy Focus Investor | HFCSX |
| Janus Enterprise T | JAENX |
| Nicholas | NICSX |
| Nicholas Equity Income I | NSEIX |
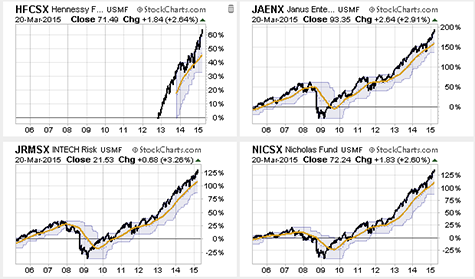
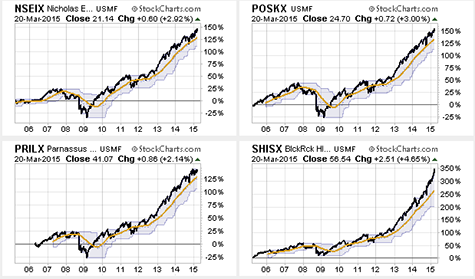
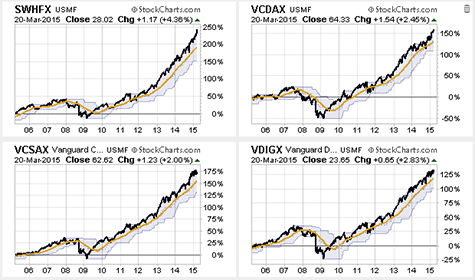
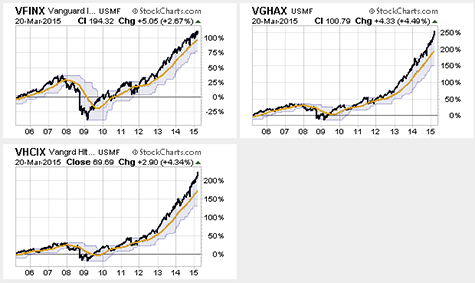
The mutual fund survivors consisted of:
This table shows the relative risk adjusted level for the mutual funds as well as their Sortino Ratios and rolling returns.

This table shows the relative risk adjusted level, plus the calendar year returns for 10 years.

Notably, only US focused funds passed the filter.
Because of the 2008 crash, and the fact that the US central bank was the first to do strong quantitative easing, that is part of the reason non-US funds don’t pass the filter. Perhaps, that will change as other nations’ central banks try to catch up, and as the US central bank backs away from its easy money policy. That certainly deserves close watching.
Unfortunately, there is no way to measure or filter the future, only the past.
Recently, certain currency hedged foreign index funds have surged in return, popularity and assets, while their unhedged analogs have lagged or declined.
The good part of that is obvious. However, because those hedges are permanent and not actively applied, the benefit will reverse and become harm when the Dollar stops its rise as it does in cycles. Actively managed hedge funds can take off their hedges when the Dollar declines, and may be a better choice.
Taking currency risk is not for the unwary. When choosing a hedged index fund over an unhedged fund you have to be right twice. You have to be right about the stock markets, and right about the currency exchange rates. Be careful with hedged/unhedged index fund choices.
We will update this list from time-to-time to attempt to identify shifting patterns of success.
Note that healthcare would probably be more strongly represented among the mutual funds were it not for some strong funds being closed to new investors.
Here are 10-year, weekly performance charts for the ETFs that passed the filter. The charts (from StockCharts.com) show the cumulative total return performance, as well as the 1-year moving average in gold and the 1-year price range in a light blue area around the price.

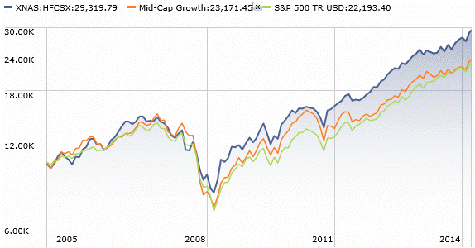
Here are 10-year, weekly charts for the mutual funds that passed the filter. Note that one chart (HFCSX) has the appearance of a short history. This is a lack of data at StockCharts which will be corrected soon, but meanwhile, we have added a 10-year chart from Morningstar below for that mutual fund.
While ETFs remain available to all so long as they are available to anyone, mutual funds are not the same.
Sometimes mutual funds close to new investments from new investors, or from all investors; and sometimes they open up after being closed. Sometimes mutual funds restrict access to those investing directly through the sponsor (as is the case with some Vanguard funds). Sometimes a fund will be unavailable or restricted at one broker and available at another.
Those conditions change over time, so this is just a current snapshot.
As must always be said, the past is not the future, but taking the past into consideration is wise, we believe.
It may well be that one or more of the funds in this article could be a good addition to, or core element, in a portfolio; particularly a portfolio in the withdrawal stage where relatively low volatility is key to long-term financial health.
Disclosure: QVM or certain clients have positions in FSPHX, VDIGX, NICSX, XLY, XLV, IBB, and SPY as of the creation date of this article (2015-03-22).
General Disclaimer: This article provides opinions and information, but does not contain recommendations or personal investment advice to any specific person for any particular purpose. Do your own research or obtain suitable personal advice. You are responsible for your own investment decisions.