The S&P 500 (NYSE:SPY) ended its best August performance since 1986 yesterday with a market message that is well worth paying attention to.
Fortunately for me (and you) a lot of what I have discussed over the last week in this commentary and in Modern Family's message came together yesterday.
The timing is perfect. I can pull it all together, and then Mish will be back to writing this commentary tomorrow with a clean slate and a new month.
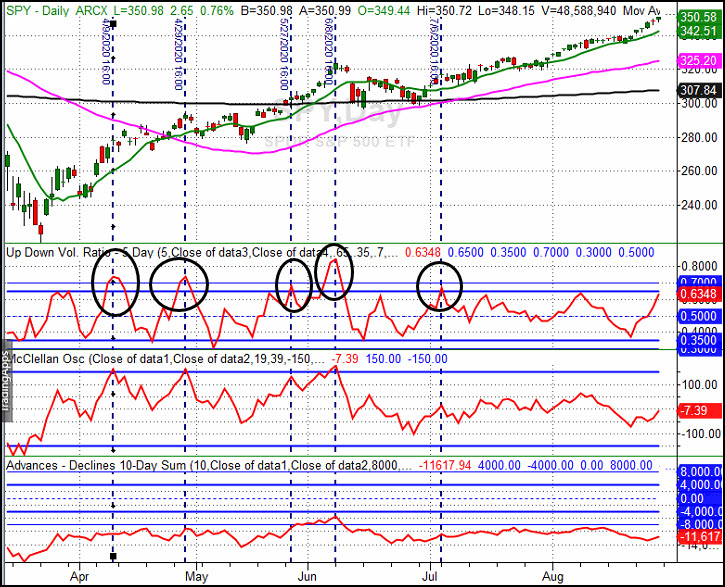
The SPY's 5-day up/down volume turned lower as illustrated in the chart below.

This is not a long-term negative, but it is a reason to at least expect a pause in the SPY, and as you can see from the other measures in this chart, this is not a very overbought level.
Important Note: the NASDAQ equivalent does NOT have the same pattern.
In addition, the SPY, Russell 2000 ETF (NYSE:IWM) and Dow Jones ETF (NYSE:DIA) all closed down on Monday. Oops.
As I explained yesterday, since the March lows, stocks have closed up on Mondays 70 to over 80% of the time depending on the index, so when they don't, something may be 'different'.
And worse, they closed under their prior day's low.
This pattern is particularly noteworthy when it's a 'first' in some time as it is now.
As a result, it will be important to look for a 30-minute Opening Range breakdown tomorrow to confirm the beginning of a down move.
If you're looking for a trade in all this, here's one…
The VXX (NYSE:VXX) continues to be strong regardless of the SPY's strength. The two cannot trend the same way for too long.
Therefore, if the SPY falls, the VXX looks ready to explode higher, and if the SPY continues up, the VXX appears to be nervous enough to hold firm.
It sounds like a good time to be long the VXX rather than short the SPY.
I'll be looking for a VXX opening range (OR) breakout, and even if you're not going to trade it, VXX trending higher will likely point to a muted potential for the SPY.
However, all the news is not bearish.
The markets rotated…
SMH (NYSE:SMH) lagged as feared, XRT (NYSE:XRT) broke down as feared, IYT (NYSE:IYT) reversed at its key breakout level, but…
IBB (NASDAQ:IBB) finally broke out of its consolidation to the upside!
Apple (NASDAQ:AAPL) and Tesla (NASDAQ:TSLA) both broke out of their ORs to the upside and ran, helping the QQQ (NASDAQ:QQQ) still close up over 1%.
Note: PDL = Prior day low, PDH = Prior day high
S&P 500 (NYSE:SPY) Traded from its HOD to LOD in the last 10 minutes, making the daily chart look worse than intra-day action suggested. Consolidation day. 340 then 335 are important support.
Russel 200 (NYSE:IWM) Closed under 10 DMA and PDL. Needs to close over 157.50 to look good. Support at 155 area, then swing low is 153.60
Dow (NYSE:DIA) Closed under PDL. Resistance at 290. Support at 280.
QQQ New high. Support at 292.50 area then 285 is 10 DMA
iShares 20+ Year Treasury Bond ETF (NASDAQ:TLT) 163.30 is strong resistance. Support at 158.50 then the 200 DMA at 155.80.
