Berkshire Hathaway (NYSE:BRKa) (Class A NYSE: BRK.A – Class B NYSE: BRK.B) is currently the seventh largest company in the S&P 500 Index by market capitalization. The company ,lead by Warren Buffett, has averaged an annual growth in book value of 19.0% to its shareholders since 1965.
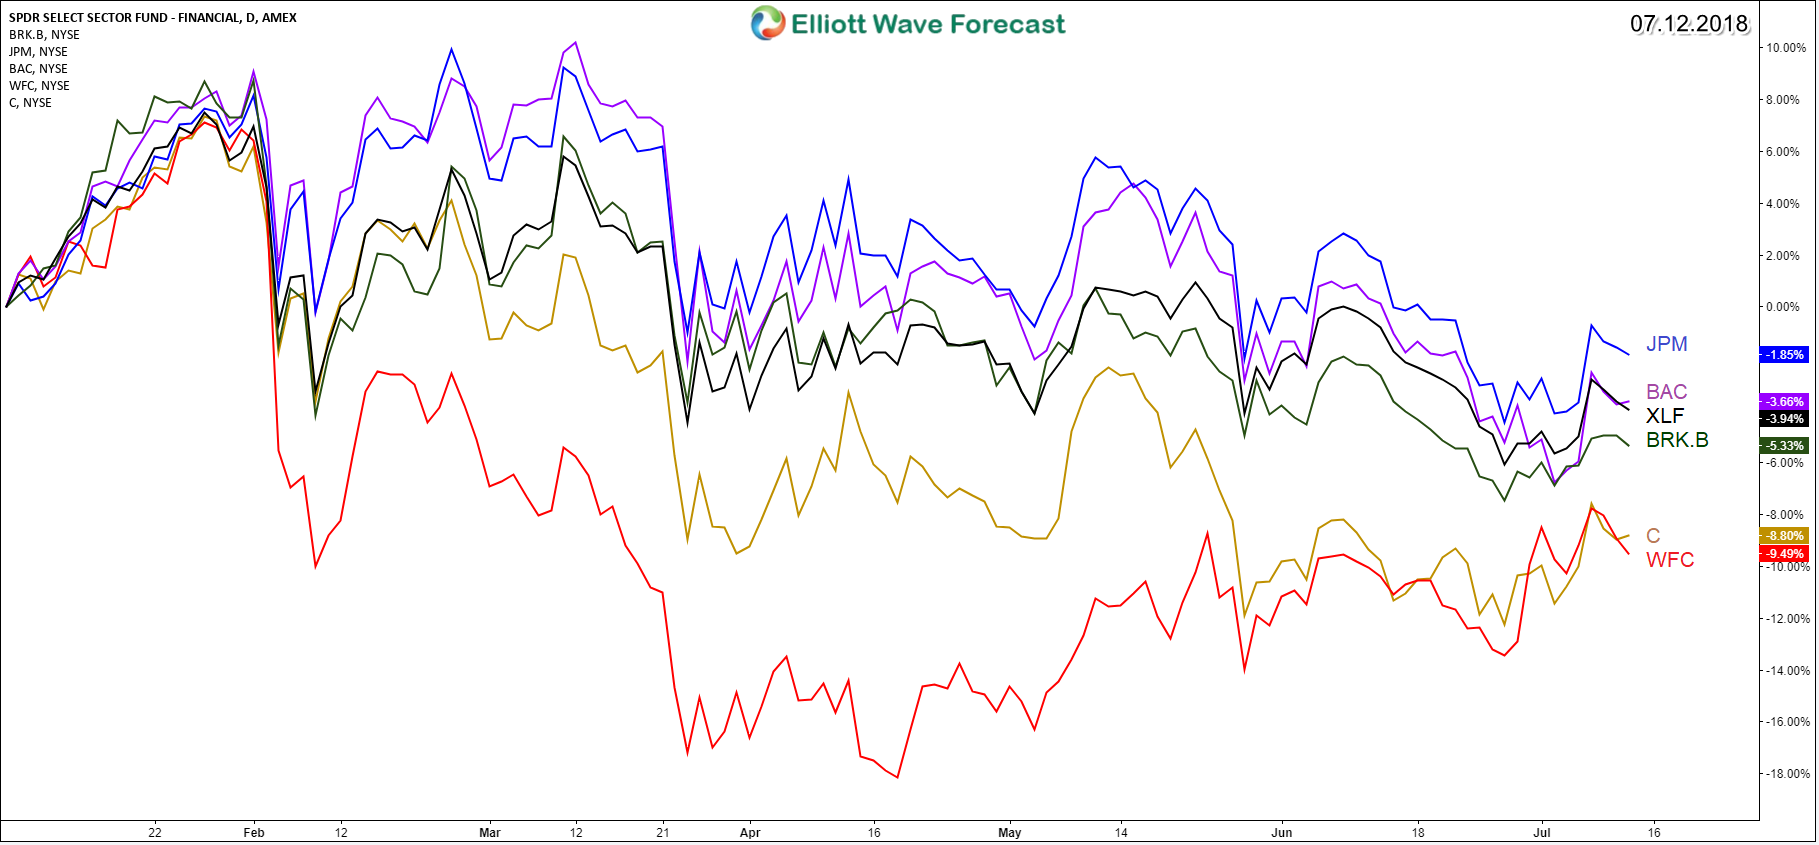
Berkshire Hathawayis one of the main stock within the Financial Select Sector SPDR Fund Financial Select Sector SPDR (NYSE:XLF). Year-to-date, the whole financial sector is still pointing in the negative side and not seeing any profit yet.
The 5 most weighted stocks in XLF are Berkshire, JPMorgan Chase & Co (NYSE:JPM), Bank of America (NYSE:BAC), Wells Fargo (NYSE:WFC) and Citibank. They will be reporting earning tomorrow and next week which may shift things around in the coming few weeks to end up with a green summer.

The stock market is turning bullish as Technology & Consumer Discretionary sectors already leading the move higher, so we need to take a look at the technical Elliott Wave structure of BRK.B to help identify the path for the Financial sector.
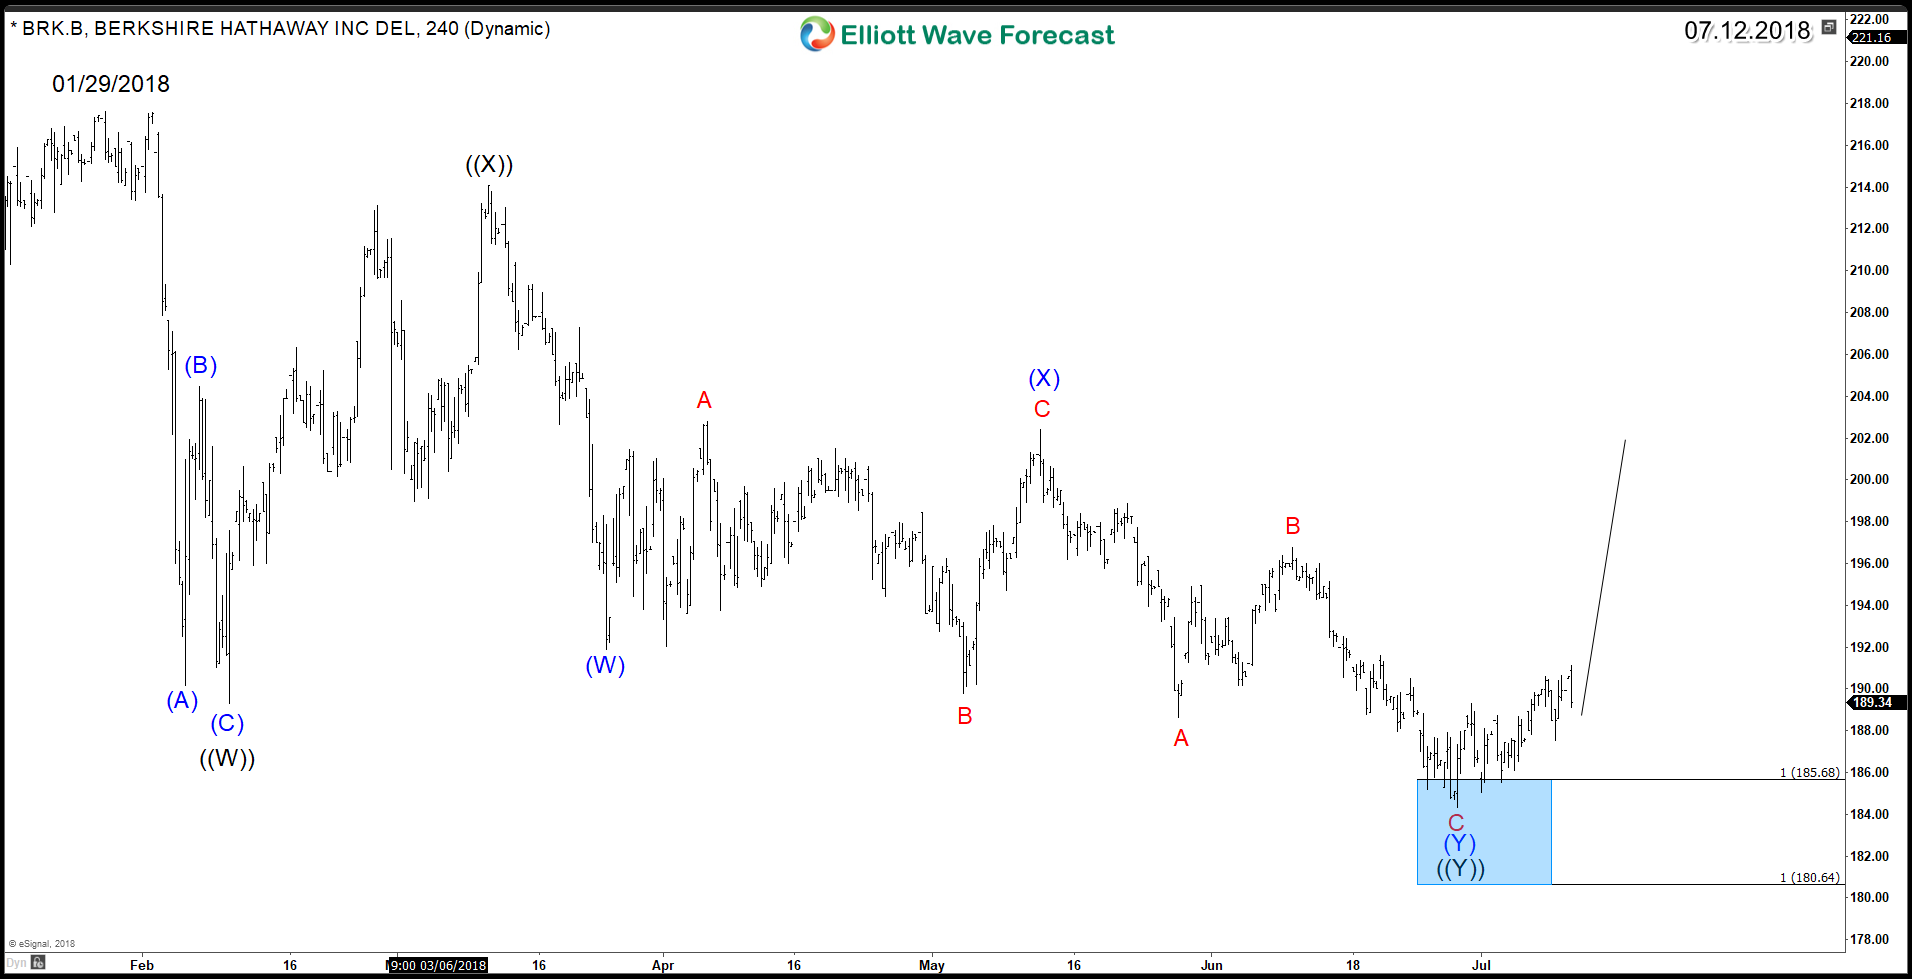
Since 01/29/2018 peak, Berkshire Hathaway did a corrective 7 swings structure ( Double Three )which reached it’s equal legs area around $185.68 – $180.64. Up from there the stock started bouncing higher and it’s expected to resume the rally to new all time highs with a minimum target at $225 – $238 area.
Berkshire Hathaway BRK.B 4H Chart 07.12.2018

Recap
Berkshire Hathaway is looking for at least a 50% bounce to correct the decline from January peak which may be followed later on by a higher move to take that peak and open a new daily cycle to the upside.
