The Nifty 50 had a marvelous run since the end of the financial crisis. Indian equities expanded substantially along the national economy. Our article here on investing.com on July 12th, 2018 discussed the relative strength of the Indian stock market already.
The wave pattern of the Indian stock market unfolded with some characteristics of its own. It showed, for example, shallow corrections within impulsive advances. Moreover, the Indian market tended to be a leader among worldwide equity indices at larger degree junctions. Last but not least, the index has been strong relative to other emerging market indices lately.
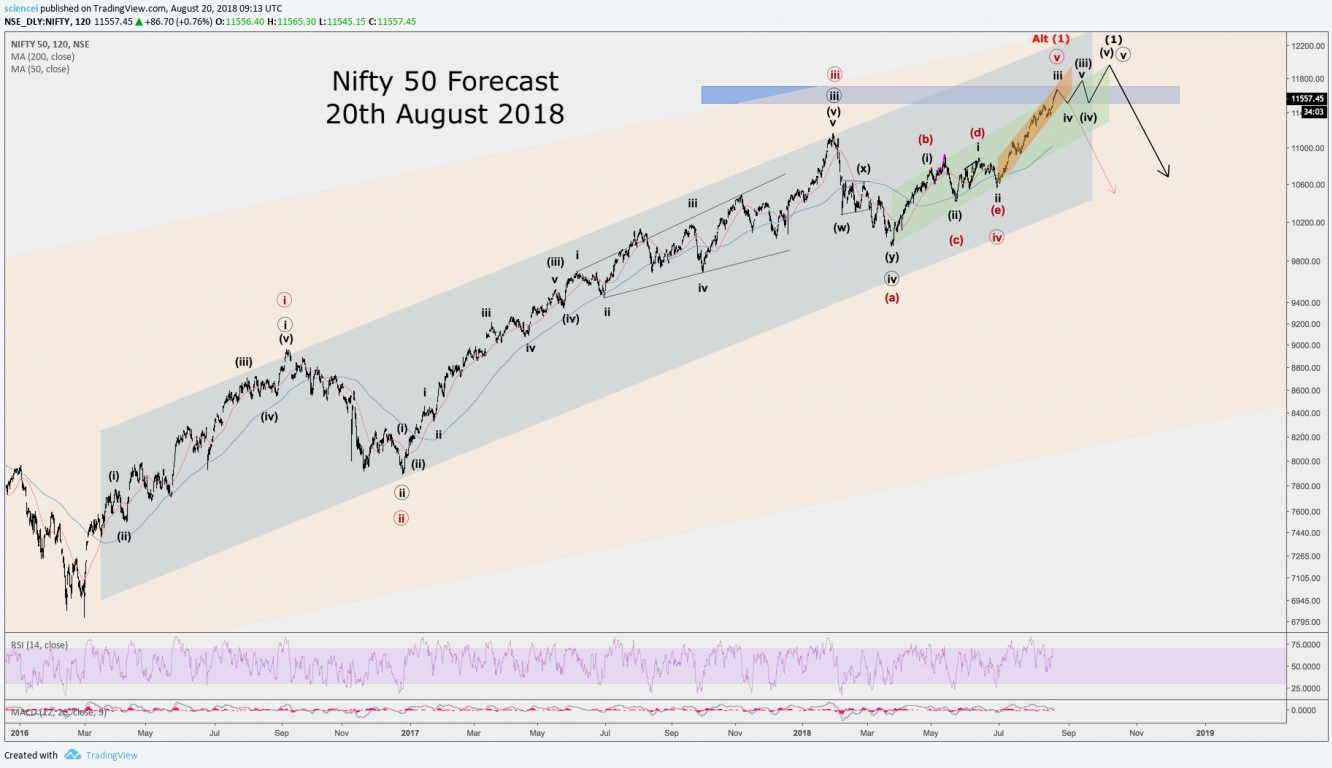
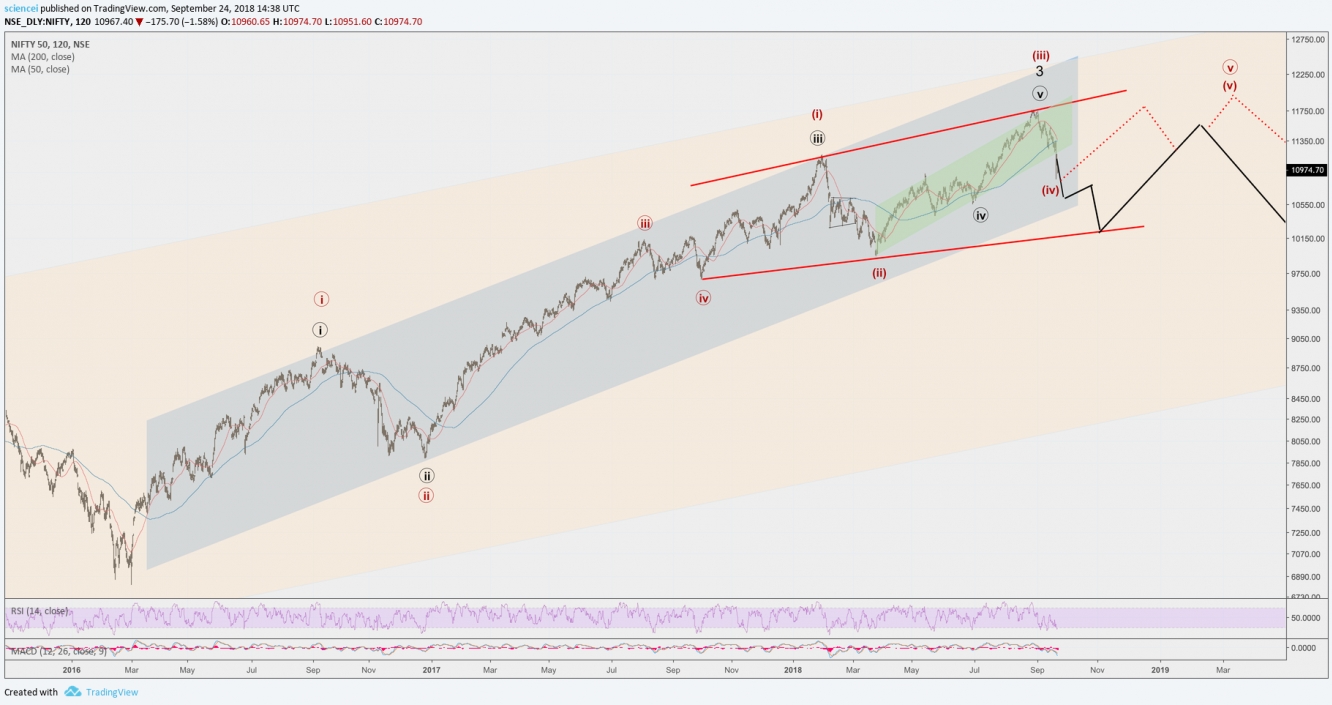
Characteristics like these, among other evidence, helped us recognize that the Nifty 50 rally isn’t over as within hours of the March 2018 bottom. Wave relationships and Fibonacci projections help us identify a rally target range of 11,500 to 11,700 index points. We highlighted the elevated risk as the Nifty approached this critical level. Our concerns seem to be getting confirmed as we publish this. The Nifty 50 caught most market participants with their pants down last week. The Indian blue-chip index stalled just 0.5% above our target range. A draw-down of nearly 8% occurred in the aftermath. As far as we know, Elliott wave analysis was the only framework that flashed red lights for this event!
So what’s the outlook for the Nifty 50 from an Elliott wave perspective for the next few months? Have we just witnessed a cyclical turn for Indian equities? The chart below shows the possible paths that we assess as most probable. Our reasoning and conclusions are the subject of discussion in our premium analysis.


