The Bank unexpectedly eased its monetary policy and said that it will conduct money-market operations to increase the country’s monetary base to JPY 80 trillion per year from JPY 70 trillion targeted previously. In addition, it will increase its purchases of government debt and extend the average duration to about 7-10 years. The JPY plunged to a six-year low against the dollar while the Nikkei 225 surged almost 3% following the announcement. The additional stimulus measures introduced from the Bank are due to worries over weak growth in consumer prices. The move from BoJ is opposite to the Fed’s end of QE this Wednesday, and it could keep JPY under increased selling pressure. On top of that, data released earlier showed that Japan’s unemployment rate ticked up and consumer prices slowed for a second consecutive month, adding to evidence that the BoJ is likely to miss its inflation target.
Elsewhere, the New Zealand dollar strengthened after Chinese authorities lifted a temporary import ban from the New Zealand’s biggest dairy exporter. Following the sharp decline witnessed on Wednesday, high-yielding currencies have regained some lost ground regardless of their central banks attempt to push the currencies down.
As for today’s indicators, German retail sales for September are forecast to fall on a mom basis adding to concerns that the Eurozone’s strongest economy is weakening. Eurozone’s unemployment rate for September is also coming out along with the bloc’s CPI estimate for October. With less than a week before the ECB meeting, the rise in the CPI rate may be a sign that the stimulative measures announced by the ECB in June and September are starting to have some positive impact, although it will clearly take time for all the measures to be enacted and take full effect. On the other hand, the decline in the German inflation rate on Thursday increases the likelihood for a possible below expectations reading in the region’s CPI estimate. This could add to fears that deflation risk in Eurozone hasn’t gone away. What’s more of a concern, is that the ECB’s stress test results released on Sunday did not consider a deflation scenario and the region’s risk of falling into deflation could undermine those results.
In Norway, we get the official unemployment rate for October. The forecast is for the rate to decline a bit, in contrast with the AKU unemployment rate released earlier this week. Following the increase in the AKU unemployment rate and the drop in September’s retail sales, NOK has been under increased selling pressure. If the official unemployment rate comes in line or better than expectations this could strengthen the Norwegian krone somewhat before the bears prevail again.
From Canada, the GDP for August is expected to have remained unchanged from the previous month. This is likely to signal that the economy is struggling for a second successive month and a possible contraction could weigh on the Canadian dollar.
In the US, we get the personal income and personal spending for September. Personal income is expected to rise at the same pace as in August, while personal spending is anticipated to decelerate from the previous month. The nation’s yoy rate of the PCE deflator and core PCE are forecast to remain unchanged, in contrast with the slowdown in the 1st estimate of Q3 core PCE in Thursday’s GDP figures. The Chicago Purchasing managers’ index and the final University of Michigan consumer sentiment, both for October are also due out.
As for the speakers, ECB Governor Luis Maria Linde speaks.
The Market
EUR/USD stays virtually unchanged
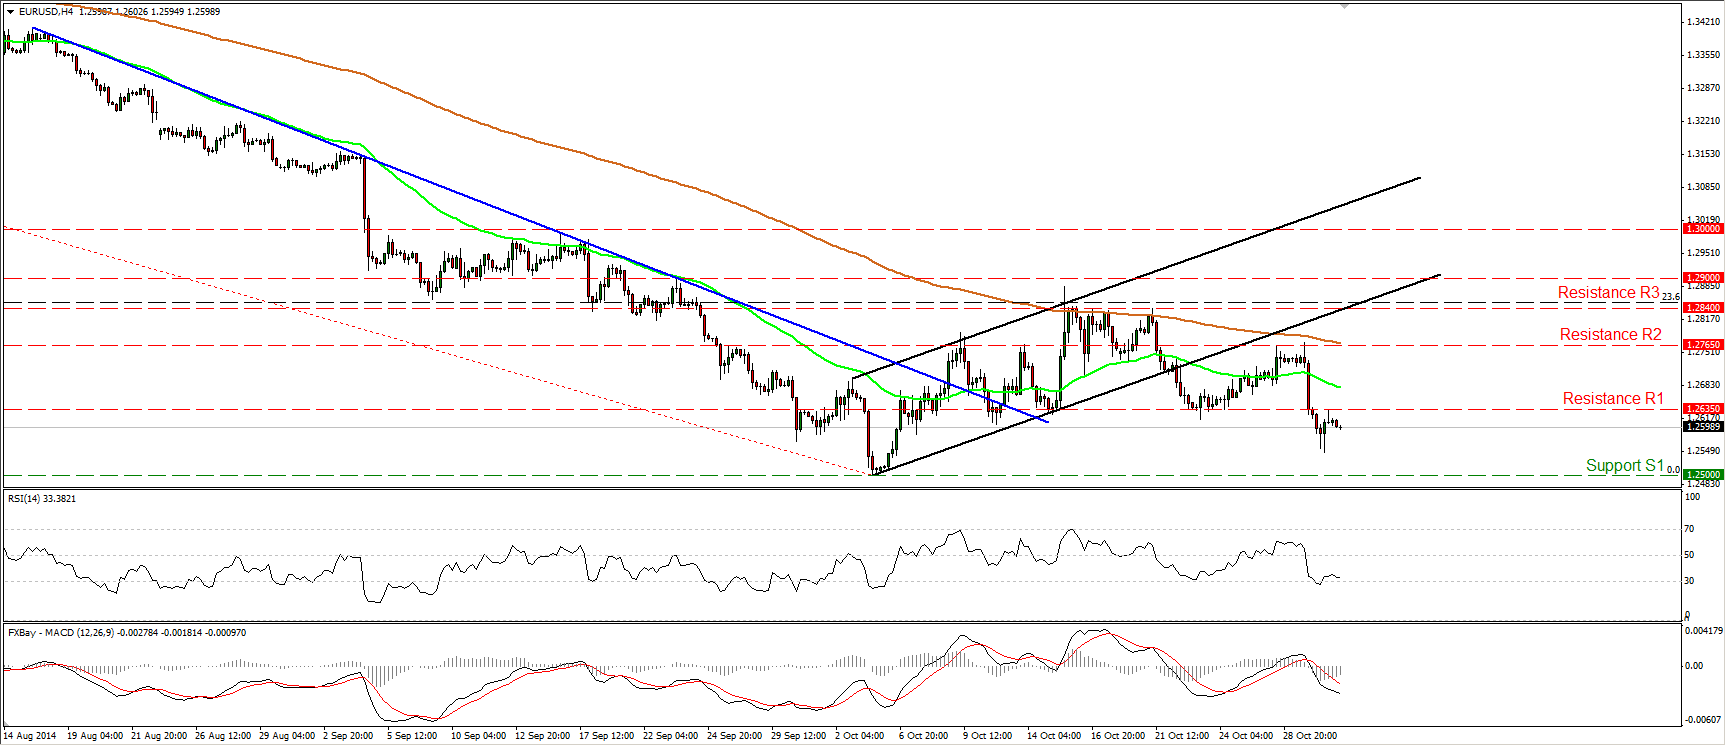
EUR/USD moved below the 1.2600 line, but the dip lasted only several hours. Then, the pair rebounded somewhat to find resistance at 1.2635 (R1). However, I will stick to the view that the recovery from 1.2500 (S1) probably ended near 1.2840 (R3), which lies near the 23.6% retracement level of the 8th of May – 3rd of October decline, and that the pair could be resuming its prior downtrend. I still expect the bears to pull the trigger for another test of the psychological barrier of 1.2500 (S1), which happens to be the 76.4% retracement level of the July 2012 – May 2014 major advance. Our daily momentum studies support the notion. The 14-day RSI moved lower after finding resistance marginally below its 50 line, while the MACD, already within its negative territory, appears willing to cross below its trigger line.
• Support: 1.2500 (S1), 1.2465 (S2), 1.2400 (S3)
• Resistance: 1.2635 (R1), 1.2765 (R2), 1.2840 (R3)
GBP/JPY surges above 175.00
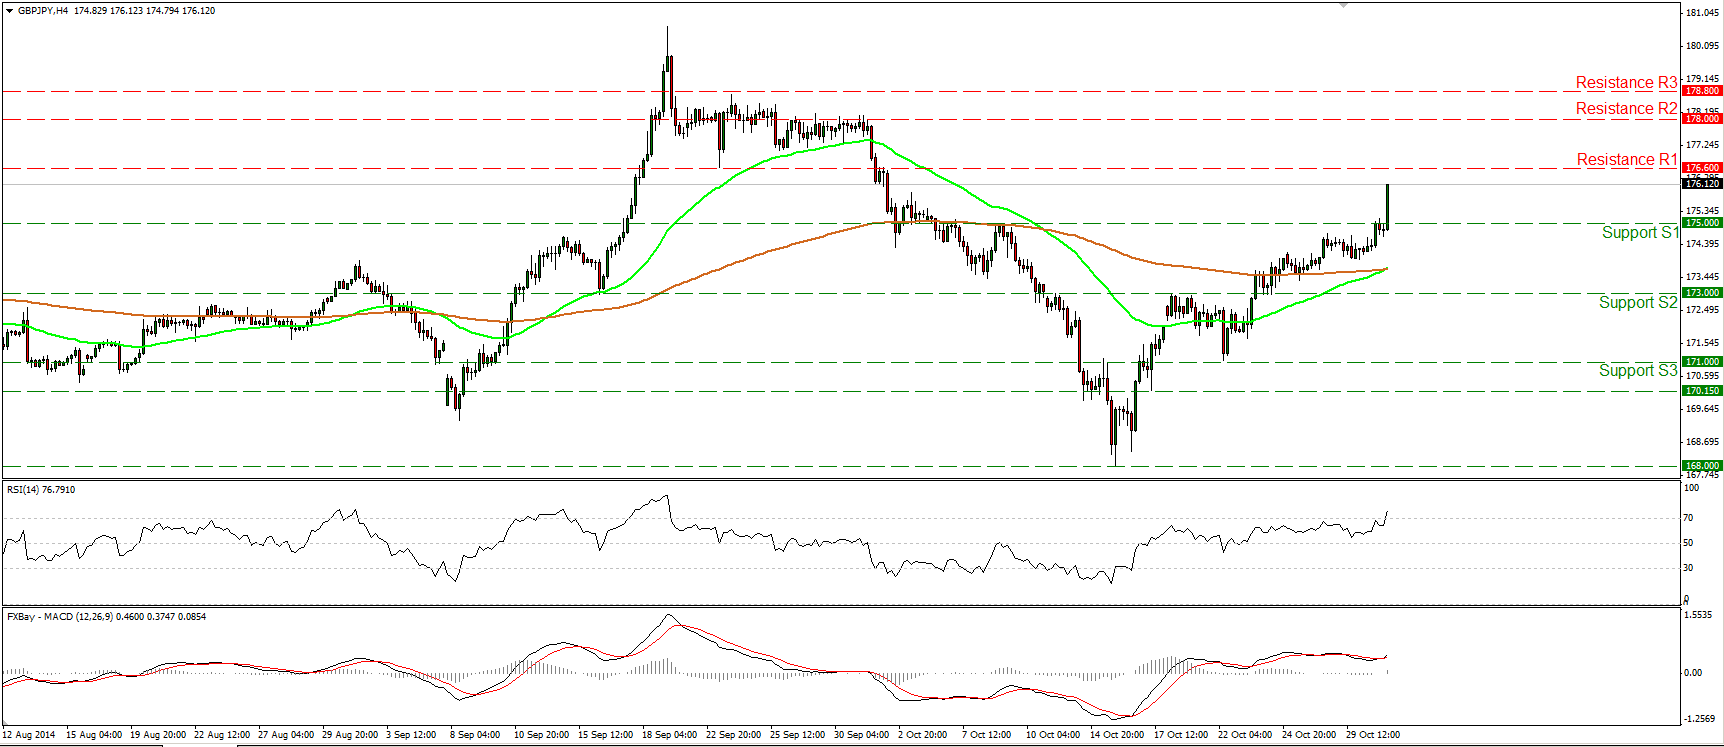
GBP/JPY surged during the early European morning, breaking above the psychological resistance (turned into support line) of 175.00 (S1). I would now expect the rate to challenge our resistance hurdle of 176.60 (R1) any time soon. If the longs are strong enough to overcome that obstacle, we are likely to experience further advances, perhaps towards our next resistance at 178.00 (R2). Shifting my attention to our momentum oscillators, I see that the RSI entered its overbought territory and is pointing up, while the MACD, already positive, just crossed above its trigger line. This designates accelerating upside speed and magnifies the case for further advances in the close future.
• Support: 175.00 (S1), 173.00 (S2), 171.00 (S3)
• Resistance: 176.60 (R1), 178.00 (R2), 178.80 (R3)
EUR/GBP is heading lower
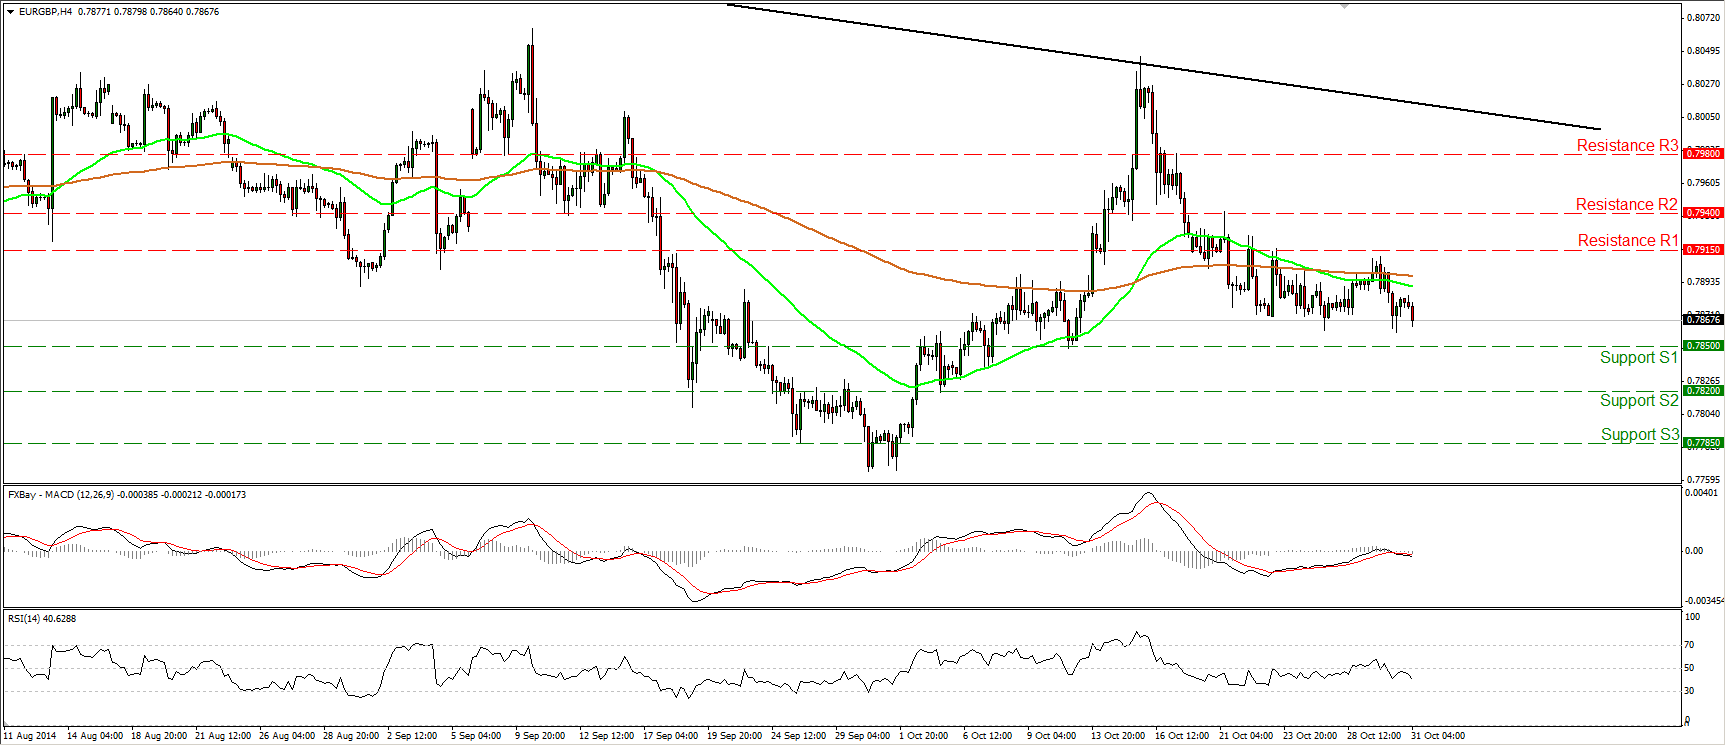
EUR/GBP moved lower yesterday, but remained above the support line of 0.7850 (S1). In my view, as long as the resistance of 0.7915 (R1) holds, the short-term bias remains to the downside and I would expect the rate to reach the support barrier of 0.7850 (S1) in the close future. A clear and decisive break below that obstacle is likely to see scope for extensions, towards our next support at 0.7820 (S2). Moreover, our momentum studies maintain a negative tone. The MACD crossed below both its zero and trigger lines, while the RSI moved lower after finding resistance near its 50 barrier. As for the broader trend, on the daily chart the pair is trading below the longer-term black downtrend line (taken from back at the high of the 1st of August), keeping the overall technical picture negative.
• Support: 0.7850 (S1), 0.7820 (S2), 0.7785 (S3)
• Resistance: 0.7915 (R1), 0.7940 (R2), 0.7980 (R3)
Gold breaks below 1205
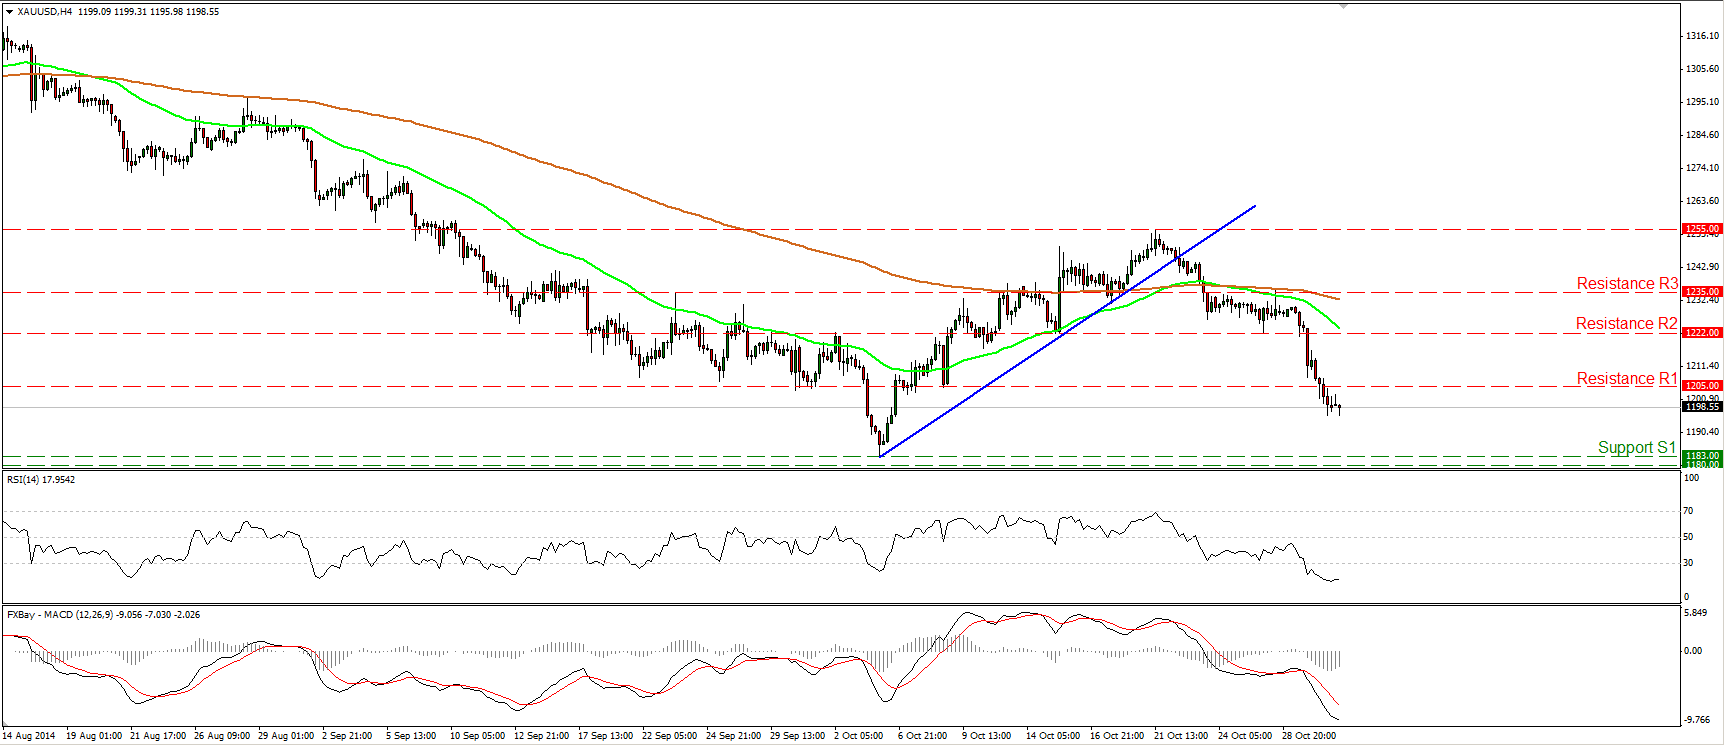
Gold continued plummeting on Thursday, reaching and breaking below the support (turned into resistance) line of 1205 (R1). I would now expect sellers to trigger extensions for another test at the critical support zone of 1180/83, defined by the low of the 6th of October 2014 and the lows of June and December 2013. The MACD remains below both its zero and trigger lines, designating strong bearish momentum and supporting the negative short-term outlook of the precious metal. However, the RSI shows signs of bottoming within its oversold territory, thus I would be careful of a possible upside corrective move before the next leg down.
• Support: 1183 (S1), 1180 (S2), 1156 (S3)
• Resistance: 1205 (R1), 1222 (R2), 1235 (R3)
WTI remains trendless
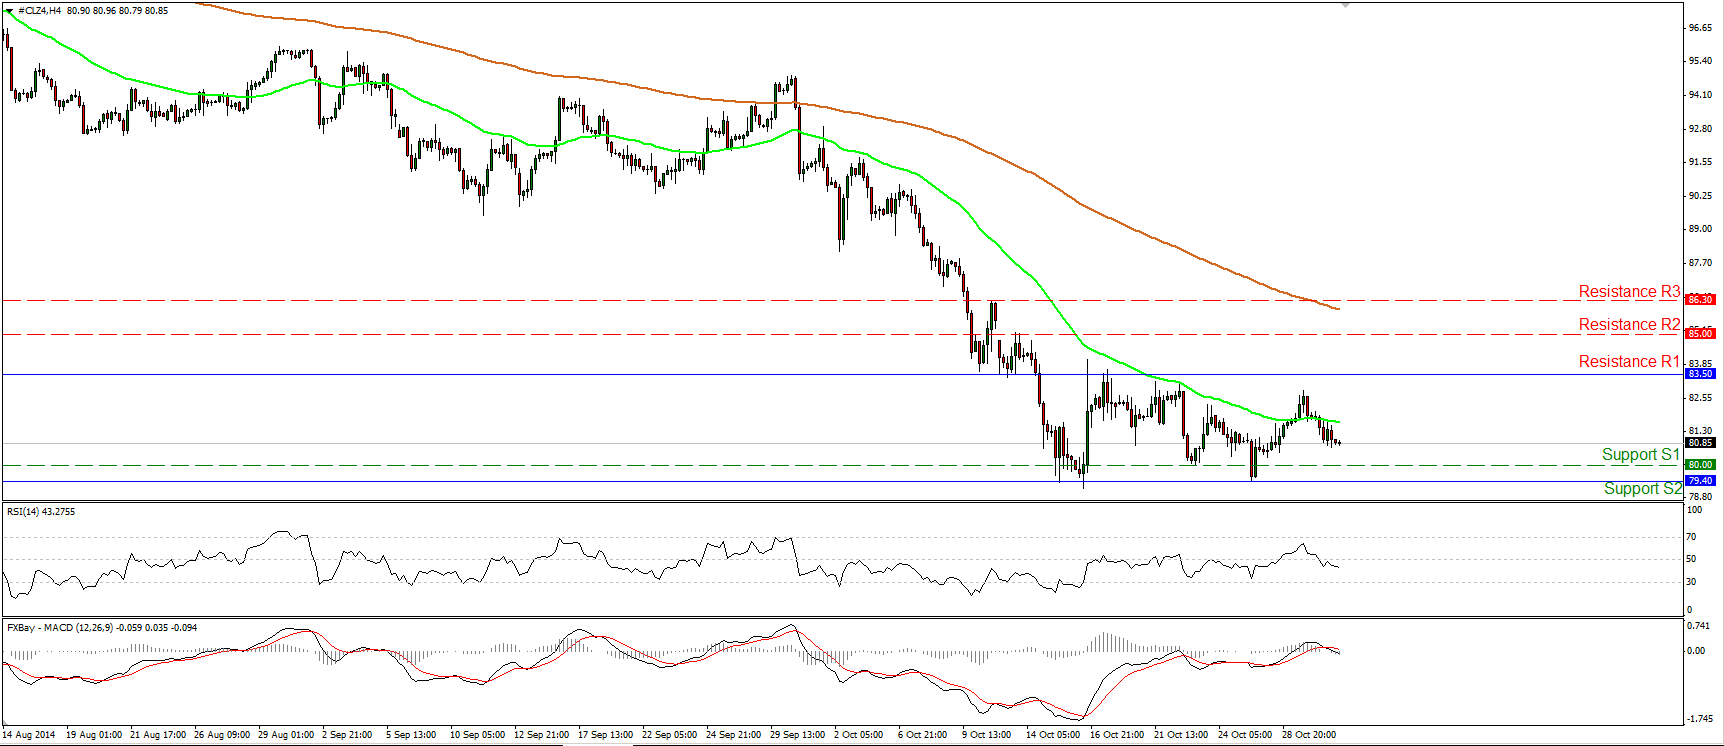
WTI declined on Thursday, but remained within its sideways path, between the support barrier of 79.40 (S2) and the resistance line of 83.50 (R1). Hence, I would maintain my neutral approach and I will repeat that a move above 83.50 (R2) is needed to flip the short-term outlook positive in my view. On the other hand, I would prefer to see a dip below 79.40 (S2), before getting more confident on the downside. In the bigger picture, although I still see a downtrend structure, the 14-day RSI exited its oversold field and moved higher, while the MACD, although below zero, stands above its signal line. These momentum signs give me additional reasons to remain neutral, at least for now.
• Support: 80.00 (S1), 79.40 (S2), 79.00 (S3)
• Resistance: 83.50 (R1), 85.00 (R2), 86.30 (R3)

