Investing.com’s stocks of the week
The S&P 500 has gone 44 months without a 10% correction. That’s the third-longest streak since the inception of the Index in 1957.
While my colleague, Louis Basenese, doesn’t view frenetic M&A activity as a sign of a Nasdaq top, I see warning signs that suggest a higher probability of a sharp overall market decline in the shorter term.
Specifically, I’m concerned about poor market breadth, which refers to the proportion of stocks advancing versus declining.
The last time I warned about deteriorating market breadth was in September 2014 – right before the largest S&P 500 decline of the year. So, my “trapdoor” indicators have been prescient in the past.
Here’s why I’m seeing a similar setup right now…
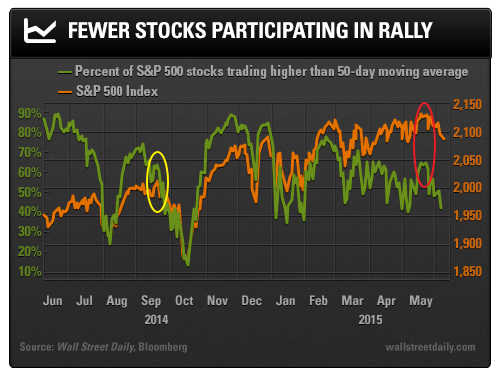
The S&P 500 reached an all-time closing high on September 18, 2015. However, less than 65% of the stocks in the Index were above their 50-day moving average (yellow circle below).

The S&P 500 proceeded to decline 7.4% on a closing basis. The peak-to-trough decline from the intraday high on September 19 to the intraday low on October 15 was 9.8%. It wasn’t a true correction, but it was close.
This spring, we’re seeing an eerily similar situation.
On May 21, 2015, the S&P 500 reached an all-time closing high. Once again, fewer than 65% of stocks were above their 50-day moving average (red circle above).
In other words, a relatively low percentage of stocks are participating in the rally.
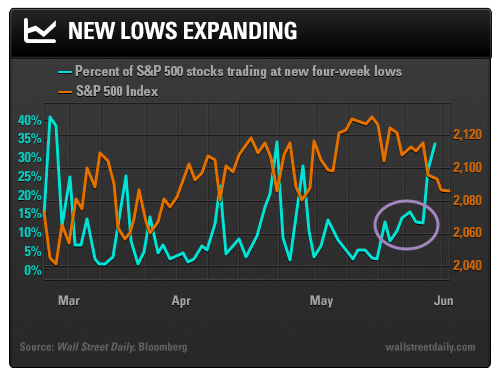
Meanwhile, a surprising number of stocks are making fresh four-week lows, just as they were in September 2014. And as you can see below, the percentage is expanding at a fast clip. This is surprising given that the broader index level has declined less than 3% from the peak.

As evidenced by deteriorating market breadth, the probability of a 10% stock market correction is rising. That would take the S&P 500 from its most recent all-time closing high of 2,130 down to 1,917.
For complacent investors as well as reckless speculators sitting on high margin debt levels, such a decline would be reminiscent of the final scene in Indiana Jones and the Raiders of the Lost Ark when everyone’s faces melt off. Yet, historically, a 10% correction is a relatively common (and healthy) occurrence… and sooner or later, it will happen again.
Safe (and high-yield) investing,
Alan Gula, CFA
