⭐ Start off 2025 with a powerful boost to your portfolio: January’s freshest AI-picked stocksUnlock stocks

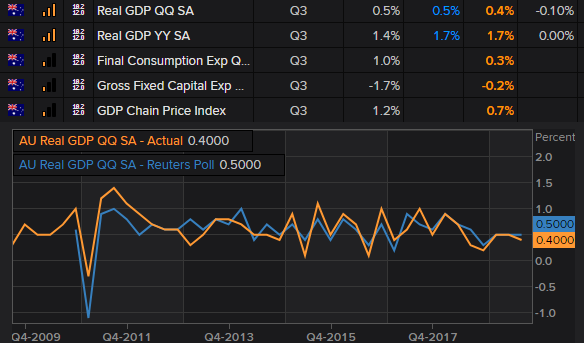
Australia GDP Miss Undermines RBA’s ‘Gentle Turning Point’

Published 12/04/2019, 01:02 AM
AUD/USD
-
AUD/CHF
-
AXJO
-
AU GDP

It didn’t take twitter long to react and compare the soft GDP read to RBA’s expectations. As we outlined yesterday, the RBA gave themselves some very soft targets to hit and a long time to achieve them. Given they explicitly said publicly they’ll ease further if they’re not on track to hit these (soft) targets, it increases the odds for them to act sooner than the otherwise, cautiously optimistic statement suggested. Again, it underscores why we pay more attention to their speeches than their statements, as the latter tends to paint a rosier picture.

The next key data point for AUD traders this week is tomorrow’s retail sales release which is expected to rise to 0.3% from 0.2% prior, which leaves room for disappointment. Key data from the U.S. includes ISM non-manufacturing later today and of course NFP on Friday.

Add into the mix Trump’s new relaxed approach to trade talks which is weighing on equities, then there’s a bearish case to be made for the Aussie over the near-term.
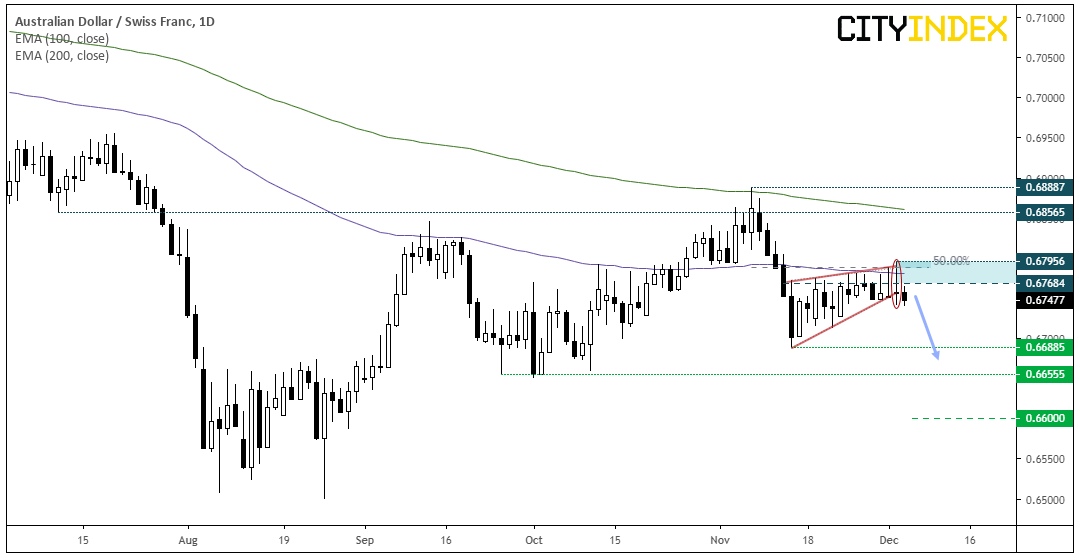
AUD/CHF Daily Chart

AUD/CHF is coiling up within a potential bearish wedge pattern. Since the 19th November, there have been 8 sessions with high wicks which failed to close above 0.6785, making it an important level of resistance to monitor. In context of yesterday’s bearish outside candle and that today’s high is also below 0.6785 resistance, the path of least resistance could point lower.

However, for this to have a higher probability of success, we’d likely need to see trade headlines continue to weigh on risk sentiment and retail sales miss the mark tomorrow.
  • Bias remains bearish below 0.6795, although 0.6785 is also a resistance level to monitor to either aid with risk management, or use as a threshold to fade into whilst prices remains beneath it
  • Initial target is the base of the wedge at 0.6688. Although if we’re in fact seeing a bearish flag, it projects target around 0.6600.
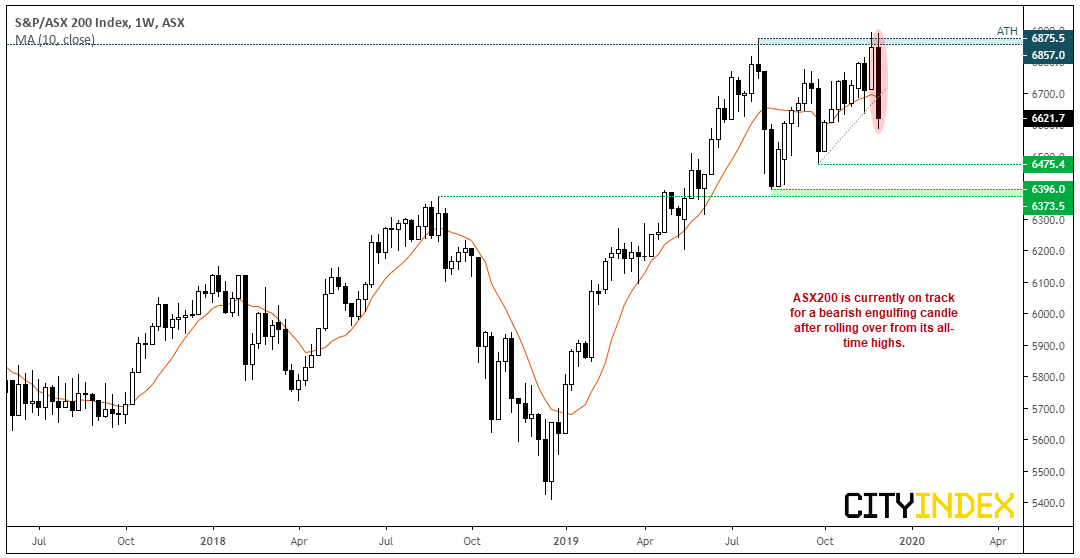
  • S&P/ASX 200 Index Weekly Chart

    The ASX 200 is on track for a bearish engulfing week (just two days into the week…). This would be the seconds bearish engulfing candle in three weeks if this turns out to be the case. We recently ran a test on a bearish outside week and concluded that they showed a higher chance of success if they close beneath the 10-week MA. When they didn’t, they showed positive returns the week after (ad indeed we saw the ASX200 rebound last week). Whilst we’re yet to repeat the test on a bearish engulfing candle, it's worth noting that it is currently beneath its 10-week MA and on track for its most bearish week this year, after rolling over form all-time highs. So expect a follow up post on this pattern if it is confirmed.

    Original Post

    Latest comments

    Loading next article…
    Risk Disclosure: Trading in financial instruments and/or cryptocurrencies involves high risks including the risk of losing some, or all, of your investment amount, and may not be suitable for all investors. Prices of cryptocurrencies are extremely volatile and may be affected by external factors such as financial, regulatory or political events. Trading on margin increases the financial risks.
    Before deciding to trade in financial instrument or cryptocurrencies you should be fully informed of the risks and costs associated with trading the financial markets, carefully consider your investment objectives, level of experience, and risk appetite, and seek professional advice where needed.
    Fusion Media would like to remind you that the data contained in this website is not necessarily real-time nor accurate. The data and prices on the website are not necessarily provided by any market or exchange, but may be provided by market makers, and so prices may not be accurate and may differ from the actual price at any given market, meaning prices are indicative and not appropriate for trading purposes. Fusion Media and any provider of the data contained in this website will not accept liability for any loss or damage as a result of your trading, or your reliance on the information contained within this website.
    It is prohibited to use, store, reproduce, display, modify, transmit or distribute the data contained in this website without the explicit prior written permission of Fusion Media and/or the data provider. All intellectual property rights are reserved by the providers and/or the exchange providing the data contained in this website.
    Fusion Media may be compensated by the advertisers that appear on the website, based on your interaction with the advertisements or advertisers.
    © 2007-2025 - Fusion Media Limited. All Rights Reserved.